Geoscience Reference
In-Depth Information
100
90
80
0
5 10 15
40
0
40
1
0
1
Cupri
Electrons,
Neutrals,
% Fluctuations
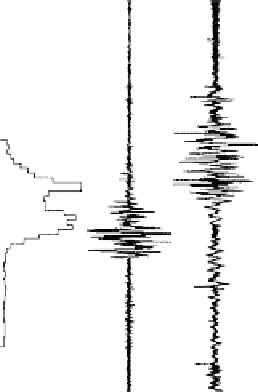
Figure 7.12
S/N ratio from a radar and relative electron and neutral density fluctua-
tions (in %) simultaneously measured in situ in flight NBT5 of the NLC-91 campaign.
[After Lübken et al. (1993). Reproduced with permission of the American Geophysical
Union.]
is fairly complicated but the basic idea is valid. Schmidt numbers well over 1000
have been indicated (Nicolls et al., 2008).
Turning to edge scatter, it is clear that a high
S
c
also allows sharp gradients
to exist but, unlike the turbulence theory by Batchelor (1959), we as yet have no
explanation of the sharp edge phenomenon. The wavelet analysis of rocket data
taken during PMSE (shown in Fig. 7.11) illustrates just how sharp these edges
can be. The scalogram clearly shows that submeter scale components exist on the
edges, and a quantitative analysis shows that VHF scattering can be explained
(Alcala et al., 2001). This type of scatter clearly leads to aspect sensitivity, since,
for a radar beam off vertical, the specular-like scatter would not yield a return
signal. Aspect sensitivity can also occur if the turbulence is itself anisotropic
(Bolgiano, 1968). Since the sharp edges on the rocket data are somewhat rare,
it is likely that most aspect sensitivity is due to anisotropy in the turbulent
structures.
Recently, a UHF radar was installed near Fairbanks, Alaska (Poker Flat Inco-
herent Scatter Radar). Figure 7.14a shows an example of ice-related echoes at
a Bragg wavelength of 33 cm near 82 km. These echoes were obtained at night,
implying that auroral particle precipitation produced the plasma necessary to
charge the particles. Indeed, the dispersed echoes up to 90 km (and above but


Search WWH ::

Custom Search