Geoscience Reference
In-Depth Information
20
10
10
MST radar S/N (dB)
0
20
30
40
20
10
10
MST radar S/N (dB)
0
20
30
40
100
100
95
95
90
90
85
85
80
80
75
75
70
70
10
2
10
4
Electron density (el/cm
3
)
10
3
10
2
10
4
Electron density (el/cm
3
)
(b)
10
3
(a)
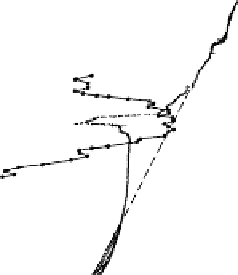
Figure 7.7
Height profiles of the rocket-borne electron density measurements and
MST radar echo signal-to-noise ratio (S/N) (solid circles) for the (a) STATE 1 and (b)
STATE 3 rocket flights. The dashed lines illustrate a more typical D-region profile.
[After Ulwick et al. (1988). Reproduced with permission of the American Geophysical
Union.]
process is of considerable interest in its own right and is discussed at length in the
next section. Another way to monitor NLC involves lidar, a method analogous
to radar but using light waves instead of radio waves (also see below). Finally,
rocket instrumentation has been developed in the 1990s to detect dust and ice
particles (Havnes et al., 1996; Gelinas et al., 1998).
Figure 7.7 shows examples of simultaneous rocket and radar data taken in
Alaska. The radar echoes in the left-hand panel were collocated with a burst
of turbulent electron density structure while in the example on the right the
echoes are collocated with a bite-out with electron density. It is important to
point out that the sun is shining nearly 24 hours a day in this height range and
that the mesosphere is a weakly ionized plasma. Thus, the deep plasma density
depletion is unexpected since the solar ionization is a smooth source of plasma.
The radar echoes are very strong in both cases for this height range—many
orders of magnitude higher at VHF than detected elsewhere at this altitude.
These early results suggested that more than one mechanism was responsible for
the huge radar echoes (Kelley and Ulwick, 1988). STATE 1 is consistent with
a turbulent-like process for the scatter (Fig. 7.7a) whereas STATE 3 is quite
different (Fig. 7.7b) and may be due to very sharp edge effects called partial
reflection.
Figure 7.8 shows a more recent rocket flight. Again, a bite-out in the electron
density occurred (panel b) in the center of a strong VHF radar event (panel e). At


Search WWH ::

Custom Search