Geoscience Reference
In-Depth Information
The SEEK experiment, August 20, 1996
Theory
(a)
(b)
(c)
(d)
140
00:30 LT
T
120
100
GD
A zonal wind
A meridional wind
80
−
100
0
100
10
4
10
5
10
6
00:00
01:00
0 10 20
Growth
rate (s
−
1
)
30
Velocity (m/s)
Plasma density (cm
−
3
)
Local time (hour)
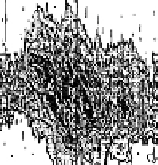
Figure 6.43
Comparison between experiment and theory for the data from the SEEK
campaign: altitude profiles of winds (left-hand panel) measured by M. Larsen (Clemson
University); an altitude profile of electron density (left-center panel) measured by T. Ono
(Tohoku University); altitude-time distribution of 6.1-m backscatter intensity (right-
center panel) measured by R. Tsunoda (SRI International) and altitude dependencies of
theoretical positive growth rates (right-hand panel) for the neutral wind-driven gradient
drift (GD) and thermal instabilities (TI) calculated for the neutral wind distribution on
the left-hand panel.
J
0
B
o
u
n
(a)
δ
T
i
δ
T
i
δ
N
high
+
+
−
δ
E
−
δ
E
−
+
−
+
−
−
δ
T
i
+
+
−
δ
E
−
δ
N
−
δ
E
K
+
low
v
i
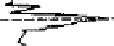
Figure 6.44
A schematic diagram of the thermal instability.
Kelley, 2000). This theory is compared with the experiment in Fig. 6.43. The
thermal growth rate is plotted in the right-hand panel along with the wind-driven
gradient drift growth rate. The thermal instability greatly increases the altitude
range of the instabilities.
Dimant and Sudan (1995) have proposed a similar thermal instability driven
by strong auroral zone electric fields and Dimant and Oppenheim (2004) have
revisited the Kagan and Kelley (2000) idea. One caveat is in order, however. At
this time there is some debate over whether the altitudes listed in figures such
as Fig. 6.43 are correct or whether, in fact, the signals are coming from the
antenna sidelobes or are just due to the decreasing range of Q-P structures (see
Section 6.7.1).


Search WWH ::

Custom Search