Geoscience Reference
In-Depth Information
February 17, 1999
500
450
400
350
300
1
.0
3
10
6
7
.5
3
10
5
5
.0
3
10
5
10
5
2
.5
3
250
200
150
100
0
10
4
1
.0
3
5
.0
3
10
3
0
100
50
0
50
2
100
2
Perp North
Perp East
20
21
22 23
Local time (AST)
00
01
02
Figure 6.25
The top panel shows the electron densitymeasured by theArecibo incoherent
scatter radar during the night of February 17-18, 1999. Note the scale change at 200 km
altitude. Below, the two components of the drift perpendicular to
B
are given. [After Kelley
et al. (2000b). Reproduced with permission of the American Geophysical Union.]
2
20
Deviation(%)
20
2
20
Deviation(%)
20
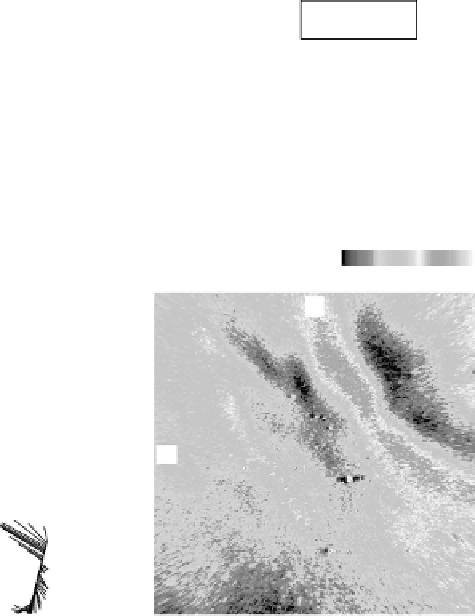
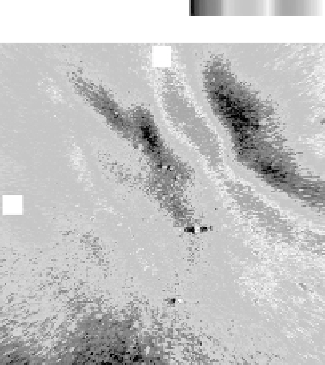
Shigaraki 630 nm
Altitude: 300 km
May 17, 2001, 1220:49UT, 1024 km
Shigaraki 630 nm
Altitude: 300 km
May 17, 2001, 1220:49 UT, 1024 km 3 1024 km
N
3
1024 km
N
W
W
Perpendicular ion drift
Electric field vector
DMSP F15
1221:18-1224:29 UT
DMSP F15
1221:18 -1224:29 UT
1 mV/m
30 m /s
(a)
(b)
Figure 6.26
Polarized electric field in nighttime MSTID. 630 nm airglow for May 17,
2001, along with perturbation drifts and electric fields from a DMSP satellite pass. [After
Shiokawa et al. (2003). Reproducedwith permission of the AmericanGeophysical Union.]


Search WWH ::

Custom Search