Geoscience Reference
In-Depth Information
1 0
2
1
L a t e t i m e b a s t r i a t i o n s ( F E R N )
E q u a t o r i a l s p r e a d F
1 0
2
2
1 0
2
3
1 0
2
4
1 0
2
5
1 0
2
6
1 0
2
7
1 0
2
8
1 0
0
1 0
1
1 0
2
1 0
3
W a v e n u m b e r ( k m
2
1
)
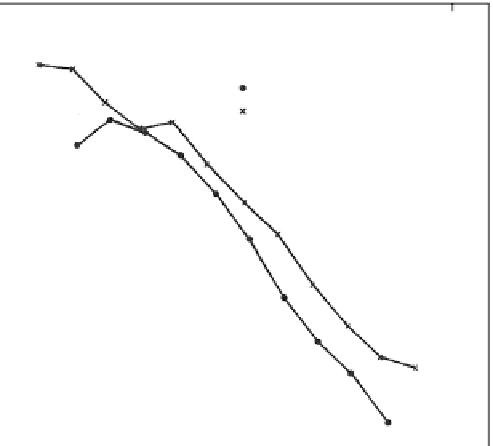
Figure 6.21
Filled circles indicate the wave number power spectrum of the data shown
in Fig. 6.20. Also shown (crosses) is a spectrum from a rocket flown into equatorial spread
F conditions. [After Kelley et al. (1979). Reproduced with permission of the American
Geophysical Union.]
with spread-F data, which is driven by the gravitational term in the generalized
Rayleigh-Taylor instability. The similarity is remarkable and gives further evi-
dence that the active barium cloud experiment indeed mirrors natural phenom-
ena quite well. This barium cloud spectrum is included in the set presented in
Fig. 4.5a, which dramatically shows the similarity to CEIS/ESF spectra.
The growth rate for the
E
B
instability for a “local” calculation, ignoring,
among other things, the plasma effects due to electrical coupling along the mag-
netic field lines is (from Chapter 4),
×
E
/
γ
=
BL
(6.16a)
where
L
is the inverse gradient scale length of the cloud. For typical midlatitude
conditions
E
/
B
=
50m/s while typical barium clouds have
L
∼
6000m, and
γ
=
(2min)
−
1
. For the natural case the growth rates are lower since the
gradients are weaker but they are still significant.
A first-order correction to (6.16a; see Francis and Perkins, 1975) is given by
thus
BL
k
2
k
2
k
0
)
=
Pb
(
)
E
/
γ(
k
+
+
(6.16b)
Pc
Pb


Search WWH ::

Custom Search