Geoscience Reference
In-Depth Information
0
2
5
0
2
5
8
4
0
2
4
2
8
8
4
(
S
Pb
)
2
1
0
R
1
5
2
4
1
R
2
5
(
S
Pc
)
2
1
V
0
2
8
9 0
1 2 0
1 5 0 1 8 0
T i m e ( s e c )
2 1 0
2 4 0
2 7 0
2
( a )
( b )
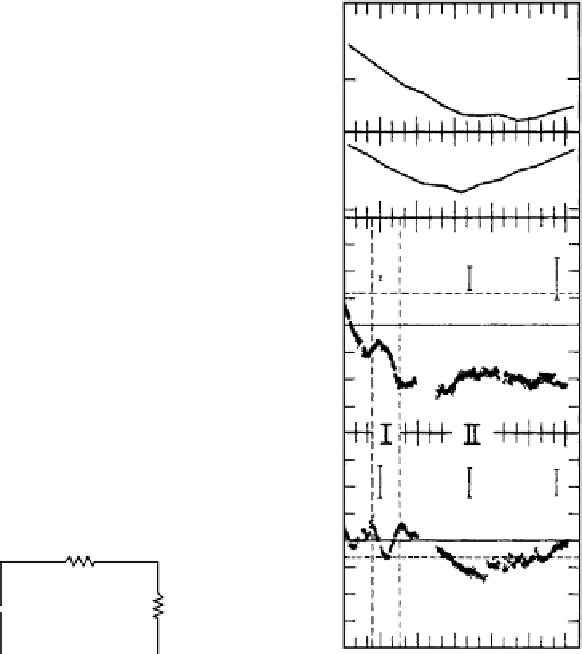
Figure 6.19
(a) Circuit diagram analog for the effect of a barium cloud on the electro-
dynamics of the ionosphere. Here,
V
0
is the applied voltage due to the ambient electric
field,
R
1
=
(
Pb
)
−
1
is the resistivity of the ionosphere and
R
2
=
(
Pc
)
−
1
is the resistivity
of the cloud. (b) Electric field signatures during an ionospheric rocket flight through a
midlatitude barium cloud. The measurements were made in situ and show that
E
is con-
siderably smaller inside the barium cloud (between the dashed lines) than outside. The
magnetic field instrument was located on the ground. [Part (b) after Schutz et al. (1973).
Reproduced with permission of the American Geophysical Union.]
We have already discussed in Chapter 4 why an electric field produces an
instability in the plasma. Another way to understand the instability of a barium
cloud and formation of the striations that are apparent in the photograph in
Figs. 6.17 and 6.18 involves the shorting effect discussed previously. Consider
alternating regions of enhanced and depleted plasma density. That is, consider
a small initial sinusoidal perturbation that occurs on the particular side of a


Search WWH ::

Custom Search