Geoscience Reference
In-Depth Information
West
East
(a)
5
0
25
2
5
Flight leg 3
Flight leg 1
0
25
2
10
10
215
2
2
15
1.5
20
225
1.0
0.5
1.5
0
1.0
2344
2346
2348
2350
2352
2354
2356
2358
0.5
Time (UT)
0
0
2304
2306
2308
2310
2312
2314
2316
2318
2320
Flight leg 4
Time (UT)
25
210
2
5
0
2
Flight leg 1
15
1.5
5
210
2
1.0
0.5
15
0
2
20
18
16
14
12
2
25
Time (UT)
1.5
0
Flight leg 5
1.0
25
2
Aircraft turning
0.5
10
0
2
15
1.5
2328
2326
2324
Time (UT)
2322
1.0
0.5
0
28
30
32
34
36
38
40
42
44
Time (UT)
(b)
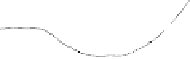
Figure 6.16
(a) Schematic diagram of an airplane flight path near Ascension Island and
a satellite transmission link through a plasma uplift. (b) Data from five consecutive passes
similar to the one illustrated in (a). For each leg the scintillation intensity and total electron
content are plotted. The structure is clearly enhanced on one side of the bubble and decays
with time. (Courtesy of R. Livingston.)


Search WWH ::

Custom Search