Geoscience Reference
In-Depth Information
830307
830308
830309
830310
830312
830318
200
100
0
2
100
2
200
X - S
O - N
Data ave.
TGCM
X - W
O - E
Data ave.
TGCM
01
18
03
20
05
22
07
00
09
02
11
04
13
06
01
18
Time
(a)
03
20
05
22
07
00
09
02
11
04
13
06
UT
LT
400
830302
200
N
W
N
N
N
S
S
S
S
S
S
S
N
N
N
S
S
WW
S
S
S
S
W
S
S
S
W
W
N
NNN
N
N
N
N
W
N
S
S
S
S
0
N
N
W
S
W
W
S
S
S
N
E
E
E
E
S
N
W
W
W
W
W
E
W
E
E
E
N
N
E
W
W
W
E
E
E
E
W
N
W
N
E
E
E
E
W
N
W
W
W
2
200
N
N
N
N
N
E
E
N
N
N
W
W
E
W
W
E
N
N
NN
N
WW
W
W
E
E
E
TGCM (N)
TGCM (S)
TGCM (E)
TGCM (W)
E
E
2400
E
E
E
E
01
18
03
20
05
22
07
00
09
02
11
04
13
06
01
18
Time
(b)
03
20
05
22
07
00
09
02
11
04
13
06
UT
LT
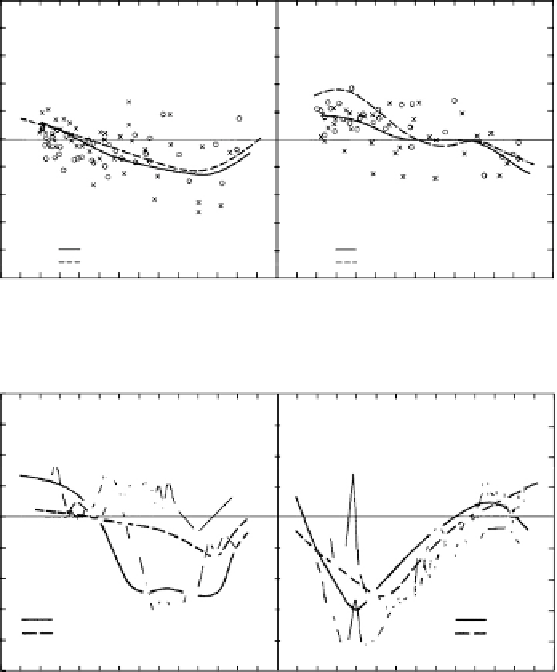
Figure 5.20
(a) Nighttime variation of thermospheric winds measured during six geo-
magnetic quiet days in early March 1983 with the year, month, and day given in the
upper right corner. The meridional and zonal wind measurements, positive northward
and eastward, are given at the left and right, respectively, with the solid line being an
average of the data points and the dashed line representing TGCM predictions for geo-
magnetic quiet conditions. (b) Nighttime thermospheric winds measured on March 2,
1983: (left) meridional winds (positive northward) measured to the north (N) and south
(S); (right) zonal winds (positive eastward) measured to the east (E) and west (W) of
Fritz Peak Observatory. The solid and dashed curves represent TGCM predictions for
constant-pressure surface near 300 km and for grid points north and south (left) and east
and west (right) from Fritz Peak. [After Hernandez and Roble (1984). Reproduced with
permission of the American Geophysical Union.]


Search WWH ::

Custom Search