Geoscience Reference
In-Depth Information
to yield a reasonable model for the diurnal and latitude variation of the iono-
spheric plasma density. The effect has been illustrated in model calculations by
D. Andersen. In the upper-contour plot of Fig. 5.4b, the zonal electric field was
taken to be zero, while in the lower plot it had the typical variation with local
time measured at Jicamarca. A considerable difference in the tropical ionospheric
density is predicted in the two different electrodynamic states. In the latter case
the zonal electric field drove the plasma to heights where recombination was
small. The plasma thus survived longer and had time to flow down the magnetic
field lines to higher-latitude regions, forming two symmetrical enhancements on
each side of the equator through the combined action of electrodynamic uplift,
pressure gradients, and gravity. In either model, a low-density trough occurs
just before sunrise. The calculation, which includes a zonal electric field, fits
observations of the equatorial anomaly quite well.
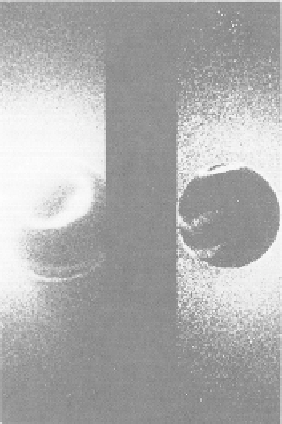
A visual indication of the equatorial anomaly obtained from an image taken
from the
Dynamics Explorer-1
satellite located nearly 8000 km above the earth
is reproduced here in Fig. 5.5. The image corresponds to an emission line that is
produced by O
+
ions when they recombine with electrons. In the photograph,
the dayside of the earth is very bright, and a ringlike halo surrounds the polar
regions. The latter is the auroral oval. Of interest here are the parallel bands
Figure 5.5
Two photographs of the earth's disk with images due primarily to neutral
oxygen emissions made from the imager on the
Dynamics Explorer-1
satellite. The ring
of airglow emissions seen at polar latitudes is due to the aurora, and the outer glow is
scattered light from the geocorona, escaping hydrogen from the earth's atmosphere. Of
interest here are the emission bands at midlatitudes. (Figure courtesy of J. D. Craven,
L. A. Frank, and R. L. Rairden.)
Search WWH ::

Custom Search