Geoscience Reference
In-Depth Information
Here,
l
i
is the wave number associated with the spectral break
2
l
i
to the
π/
viscous subrange. At mesospheric heights Hocking finds that
l
i
≈
20-40m. This
explains why typical radars do not receive echoes from mesospheric altitudes,
even though during daytime the region has numerous electrons. The Bragg scat-
tering wavelength at 50MHz is 3m and is well into the viscous subrange where
turbulent fluctuations are very small. Only the very large Jicamarca radar and
the large MU radar receive echoes under such conditions.
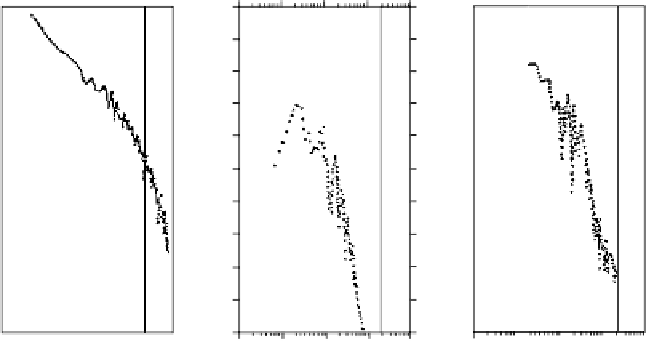
A very nice verification of these ideas came during one of the rocket flights
from Peru in 1983. The experimenters waited until strong echoes were received
at Jicamarca and then launched a high resolution electron density probe (Royrvik
and Smith, 1984). The spectrum they measured at 85
2 km is plotted in
the right-hand panel of Fig. 4.42 and shows a very steep spectrum for
.
5
±
0
.
λ
≤
2m
−
1
was small but was in quantitative
agreement with the Jicamarca radar signal strength. The high latitude winter
spectrum (central panel) is very similar to the equatorial spectrum. However,
the high latitude summer results are very different and are discussed in some
detail in Chapter 7 where the importance of charged ice is detailed.
A number of factors lead to atmospheric turbulence. The two most common
energy release mechanisms are convective and dynamic instabilities. We return
25m. The power spectral density at
k
=
Polar summer mesosphere
Polar winter mesosphere
Equatorial mesosphere
STATE 1, July '83
88-89 km
MAP/WINE night M-TS
76.9-77.4 km
CONDOR night 31.028
85.0-85.5 km
0.
0
01
0.01
0.1
1
0
0.001 0.01
0.1
1
10
0.
0
01 0.01
0.1
1
1
0
0.0
0.0
0.0
2
1.0
2
1.0
2
1.0
2
2.0
2
2.0
22.0
2
3.0
2
3.0
23.0
2
4.0
2
4.0
2
4.0
25.0
25.0
25.0
2
6.0
2
6.0
26.0
2
7.0
2
7.0
2
7.0
28.0
28.0
28.0
2
9.0
2
9.0
29.0
2
10.0
0.001
210.0
0.001
210.0
0.001
0.01
0.1
1
10
0.01
0.1
1 0
0.01
0.1
1
10
Wave number log scale
Figure 4.42
Comparison of mesospheric electron density fluctuation spectra from (left)
polar summer, (middle) polar winter, and (right) equatorial rocket launches. The vertical
line corresponds to the Bragg wave number of a 50MHz radar. [After Cho and Kelley
(1993). Reproduced with permission of the American Geophysical Union.]


Search WWH ::

Custom Search