Geoscience Reference
In-Depth Information
110
2
Quiet sun
4
1
Profile no.
Date
Rocket no.
100
5
1
2
3
4
5
Apr 1964
Jun 1965
Sep 1965
Nov 1964
Dec 1965
14.143
14.246
14.244
14.149
14.247
2
1
1
5
2
90
3
5
4
1
5
4
4
1
80
3
2
4
1
5
3
70
4
5
2
60
3
2
1
5
1
50
10
0
10
1
10
2
10
3
10
4
10
5
Electron concentration (cm
23
)
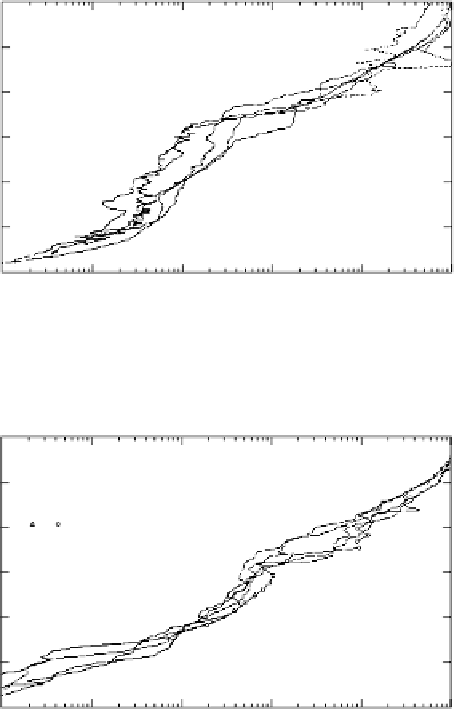
Figure 1.7a
Electron-density profiles in the lower ionosphere for quiet-sun conditions.
[After Mechtly et al. (1972). Reproduced with permission of Pergamon Press.]
110
Active sun
Profile no.
Date
Rocket no.
100
4
1
2
4
5
Jan 1969
Feb 1969
Apr 1969
Jul 1968
Sep 1969
14.391
14.392
14.393
14.361
14.395
2
5
90
1
2
4
5
80
1
1
4
70
1
2
4
60
5
2
4
1
4
5
50
10
0
10
1
10
2
10
3
10
4
10
5
Electron concentration (cm
23
)
Figure 1.7b
Electron-density profiles in the lower ionosphere for active conditions.
[After Mechtly et al. (1972). Reproduced with permission of Pergamon Press.]
Fig. 2.1b), but only the low ionization potential of NO allows a noticeable effect
by this source. The ionization profile is very smooth, so the ledge effect can-
not be explained by the source. The only other viable candidate is a height-
dependent recombination effect. The processes are complex due to the many
species involved (see Section 2.6).
Although the D region ionization is low compared to the E and F regions, it
does have a huge effect on radiowaves. This holds because radiowave absorp-
tion is particularly high when even modest electron content exists at a height
where the wave frequency equals the electron-ion (
ν
en
) collision frequency. In
10
6
s
−
1
(see Appendix B), which is comparable to AM radio
the D region
ν
en
≈


Search WWH ::

Custom Search