Geoscience Reference
In-Depth Information
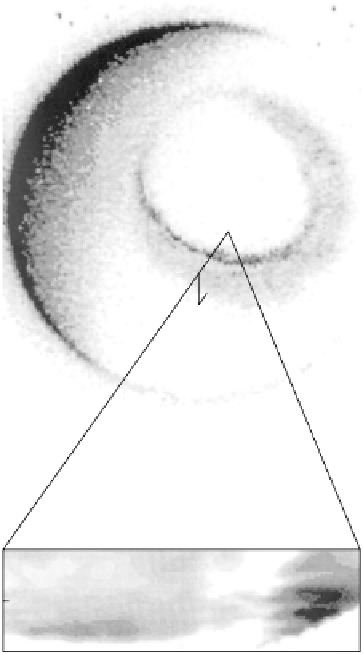
Electron density (cm
23
)
10
5
10
5
1
3
5
3
200
140
80
63
66
Invariant latitude
69
Figure 1.6
A view of the auroral oval from the
DE-1
satellite, along with simultaneous
contour plots of electron density for a small portion of the photograph. [After Robinson
et al. (1989). Reproduced with permission of the American Geophysical Union.]
of magnitude from 50 to 100 km. Any given profile exhibits at least one region of
rapid increase in density, termed a ledge, and sometimes a series of ledges during
the course of this rise. The largest difference between quiet and active solar con-
ditions occurs between 65 and 75 km, where it exceeds an order of magnitude.
The ion composition is presented in Fig. 1.8. Ion mass spectrometers have
much lower height resolution than electron instruments, so the profiles are very
smooth looking. Water cluster ions begin to form below 86 km in this case. At
night, except for the metal sporadic ion layers discussed in Chapter 5, the D
region virtually disappears, dropping to levels of 100-1000 cm
−
3
all the way to
the base of the F region, where O
+
has a long lifetime.
The dominant source of ionization is photoionization of NO by atomic hydro-
gen Lyman
α
(
λ
=
122 nm). This low-energy photon has a very high flux (see
Search WWH ::

Custom Search