Geoscience Reference
In-Depth Information
Horizontal electric fields (Upleg)
33.027-Punta Lobos, Peru
Altitude (km)
90
95
100
105
110
(West)
20
0
220
(East)
90
95
100 105
Seconds after launch
110
115
120
(West)
20
10
0
2
10
220
(East)
108
109
110
111
112
Seconds after launch
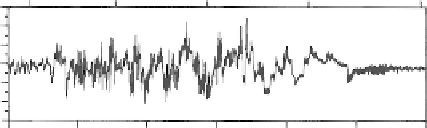
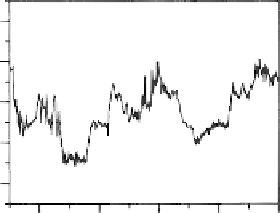
Figure 4.29
Horizontal electric fields observed during the upleg traversal of the elec-
trojet. Note the steepened waveforms and the “flat-topped” nature of the fields in the
upper portion of the electrojet (102-107 km), as also seen in the enlargement in the lower
panel. [After Pfaff et al. (1987a). Reproduced with permission of the American Geophys-
ical Union.]
the 10-15% range. The electric field and density fluctuations in these data are
interpreted as horizontally polarized electrostatic waves with wavelengths of
about 2 km. The saturation effect is not instrumental.
At about 106 km altitude, the vertical density gradient changes sign and the
large-scale waves abruptly cease. An expanded view of this height range is shown
in Fig. 4.30. Notice an almost evanescent behavior of the large-scale waves
between 106.5 and 107
3 km. Above this height the total electric field in the
second panel shows a nearly sinusoidal waveform with a 2-3mV/m amplitude.
The sonogram above this shows that the frequency of this peak changes with
time in a similar fashion, decreasing from about 80Hz to less than 20Hz in a
2 km height range as the quasi-dc field from large-scale waves decays with alti-
tude. The lower panels are the raw dc electric field signals, which show that the
superimposed wave signal is nearly a pure sinusoid. It appears only when the
detector is east-west aligned. The spectrum of this signal is shown in the lower
part of Fig. 4.31. The peak in the spectrum occurs near 2
.
.
5m. This means that
Search WWH ::

Custom Search