Geoscience Reference
In-Depth Information
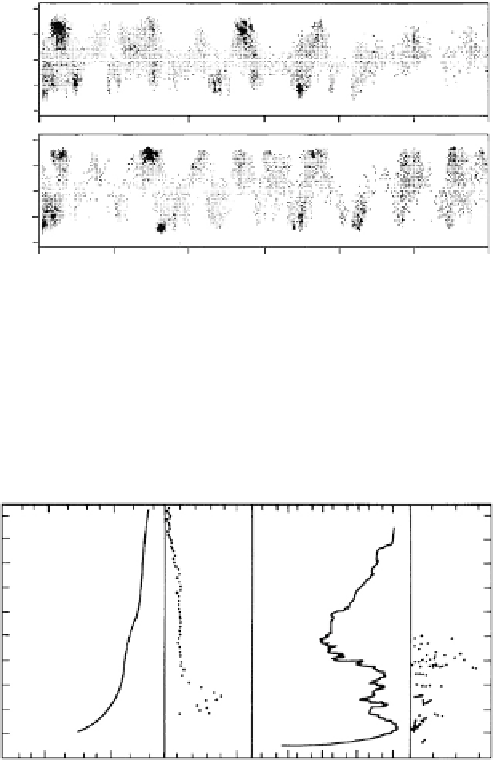
Jicamarca April 10, 1981
600
300
0
300
600
111.00 km
600
300
0
300
600
109.25 km
0
60
120
180
240
300
360
Time, seconds past 175030 LT
Figure 4.25
Doppler shift spectrogram of the vertical backscatter signal measured at
Jicamarca. Each spectrogram is normalized to its own peak power. The power val-
ues are divided into nine linearly spaced levels, with the darkest shades correspond-
ing to the largest power values. Negative Doppler velocities indicate downgoing waves.
[After Kudeki et al. (1982). Reproduced with permission of the American Geophysical
Union.]
180
180
Day
Night
160
160
140
140
120
120
100
100
80
80
10
4
Electron
density (cm
23
)
10
5
10
2
10
4
0102030
0
1.0
1-15 m
Irregularity
amplitude %
Electron
density (cm
23
)
30-300 m
Irregularity
amplitude %
Figure 4.26
Height variations of the electron density and irregularity amplitudes mea-
sured at Thumba, India, around noon and midnight. [After Fejer and Kelley (1980).
Reproduced with permission of the American Geophysical Union.]
secondary short-wavelength fluctuations also peaking whenever the zero-order
gradient shows steep downward-directed gradients. Electric field fluctuation
data taken with similar rocket trajectories and similar conditions are shown
in Fig. 4.27. Here, the upper panel is daytime data and shows strong electric
field signals both on the positive gradient and just above. The nighttime data
Search WWH ::

Custom Search