Geoscience Reference
In-Depth Information
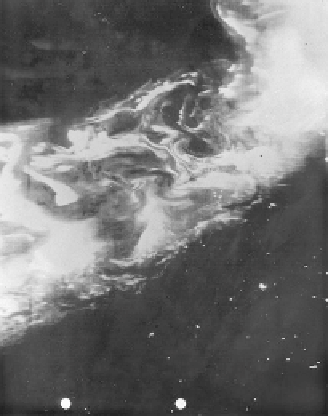
Figure 1.4
Photograph of an active auroral display taken from a high-altitude meteo-
rology satellite over Scandinavia. The center-to-center distance of the two fiducial dots
located on the lower edge is 1220 km, and the diameter of each dot is 100 km. [After Kelley
and Kintner (1978). Reproduced by permission of the University of Chicago Press.]
ionization profile. The typical energy of electrons in the nighttime aurora is
3-10 keV, and electron impact is the dominant ionization source. This energy
range results in large plasma production in the E region, as shown in the profiles
in Fig. 1.5. The production rates are more than 10 times those provided by noon-
time photoionization in the E region. Lower-energy electrons can characterize
the auroral precipitation pattern at other local times. These particles deposit
their energy at higher altitudes, creating enhanced and highly variable F-region
plasma concentrations.
A more global view of the aurora is provided by the Dynamics
Explorer-1
satellite imager, which has provided photographs looking down on the earth
from an altitude of several thousand kilometers. The photo in Fig. 1.6 encom-
passes the entire polar region and shows that the band of auroral light extends
completely around the polar zone. The auroral emissions wax and wane in a
complicated manner related to the rate of energy input from the solar wind, as
well as to the storage and release rate of this energy in the earth's magnetosphere
and its ultimate release into the earth's upper atmosphere and ionosphere. The
lower portion of the figure shows data from a scan through the ionosphere using
an incoherent scatter radar simultaneously with the DE photograph. Contour
plots of the electron density in the insert show a striking correlation with the
light emissions.
Search WWH ::

Custom Search