Geoscience Reference
In-Depth Information
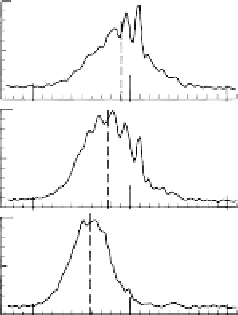
Jicamarca, Peru
16 Nov 1966, 17
h
53
m
(758W)
1.0
V
d
0.5
11
8
West
0
1.0
West
0.5
268 West
275 m/s
250 m/s
225 m/s
200
0
1.0
0.5
518 West
308
408
508 Angle
0
2150 Hz
D
0
1150 Hz
f from transmitted frequency
110
130
150
170 Range (km)
Figure 4.22
Type 2 spectra measured at 50MHz simultaneously at different antenna
zenith angles. The dashed lines indicate the average Doppler shifts. The geometry of the
experiment is shown in the top right-hand panel. The results of the experiment, together
with three theoretical curves for which a sine dependence of the average phase veloc-
ity with zenith angle was assumed, are shown in the bottom right panel. [After Balsley
(1969a). Reproduced with permission of the American Geophysical Union.]
ceased, only to reappear when the echoing region above started to fall again. It
seems clear that the zonal electric field that causes the F layer to move vertically
switched from east to west at this time, going through zero in the process. A dra-
matic example of the effect of electric field changes is shown in Fig. 4.23. Before
2044, the radar echoes came from two height ranges. For about 10 minutes they
disappeared completely, only to return again with one echoing layer exactly mid-
way between the original two echo heights. Thus, a very small threshold electric field
seems to be required for type 2 echoes. There is a definite electric field threshold for
the excitation of type 1 irregularities, however. These echoes are observed only when
the electron drift velocity is somewhat larger than the ion acoustic velocity (about
360m
s).
2.
Scattering cross section
: The scattering cross section of the type 2 irregularities is
approximately proportional to the square of the drift velocity but is independent of
zenith angle, while the type 1 scattering cross section increases rapidly with zenith
angle, peaking near the horizon. This is where the radar beam is almost parallel to
the electron flow in the electrojet.
3.
Altitude dependence of the electrojet echoes
: Fejer et al. (1975) studied the verti-
cal structure of the electrojet scattering region in detail and reported a considerable
difference in the echoing region between day and night. Figure 4.24 shows some
selected profiles of the electrojet scattered power on February 18-19, 1971, which
were observed at Jicamarca using an altitude resolution of 3 km. During daytime,
when the electron drift velocity is westward, echoes are generated between 93 and
/


Search WWH ::

Custom Search