Geoscience Reference
In-Depth Information
Wed Aug 11 10:39:14 2004
6
1000
5.8
5.6
5.4
5.2
500
5
4.8
4.6
4.4
0
4.2
21000
2500
0
500
1000
Meridional distance (km)
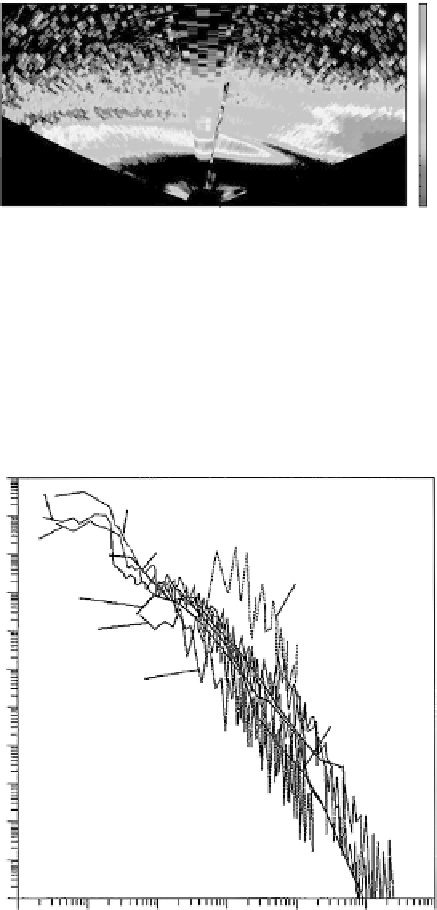
Figure 4.4
Incoherent backscatter map of the equatorial zone during a CEIS event.
The depleted plasma region follows the contour of the magnetic field lines. The strong
signals just off vertical were detected when the radar was pointed perpendicular to the
magnetic field lines. The magnetic equator is located near 5 degrees south of the radar.
The equatorial anomaly can be seen at the right. The color scale corresponds to log
10
n
(from 4.2 to 6.2). (Figure courtesy of D. Hysell.) See Color Plate 4.
10
1
B
A
10
0
C
E
10
21
G
10
22
F
10
23
I
10
24
H
10
25
D
10
26
10
27
10
28
10
29
10
210
10
22
10
21
10
0
10
1
10
2
Wavenumber (km
21
)
10
3
10
4
Figure 4.5a
Eight different vertical wave number spectra directly measured in unstable
ionospheric conditions: A-C Kwajalein; D, G, H, I Peru; E Brasil; F Florida Ba cloud (see
Chapter 6). The most unusual spectrum (G) was obtained on the wall of a plume and
may be due to a wind-driven secondary instability (LaBelle et al., 1986). [After Kelley
and Hysell (1991). Reproduced with permission of Pergamon Press.]


Search WWH ::

Custom Search