Geoscience Reference
In-Depth Information
correspond to the wave number responsible for Jicamarca and Altair backscatter.
The satellite horizontal spectra show a peak at 200 km and a secondary (local)
maximum near 50 km. Both of these features are detected in the HF data (see
Fig. 4.12 and related discussion of the HF technique).
A new dimension to our understanding of CEIS came with the advent of elec-
tric field measurements in Project Condor. The first spectral data of this sort are
shown on the right-hand side of Fig. 4.5c. It is important to note that the electric
field spectrum is almost featureless, while the density spectrum changes form at
40Hz, which corresponds to a wavelength of about 50m. Even better data were
obtained in the Kwajalein campaign, which we explore further in Section 4.4.
It is clear, however, that the physics changes in the 50-100m scale size regime.
Time — UT
1041
1042
1043
6
A
5
B
C
4
13 August 1978
D
700
600
500
AE-E
400
300
50 dB
40 dB
30 dB
20 dB
10 dB
0 dB
200
1039:45 UT
1033:49 UT
1026:02 UT
100
2300
2200
2100
0
100
200
300
Magnetic east distance from Altair (km)
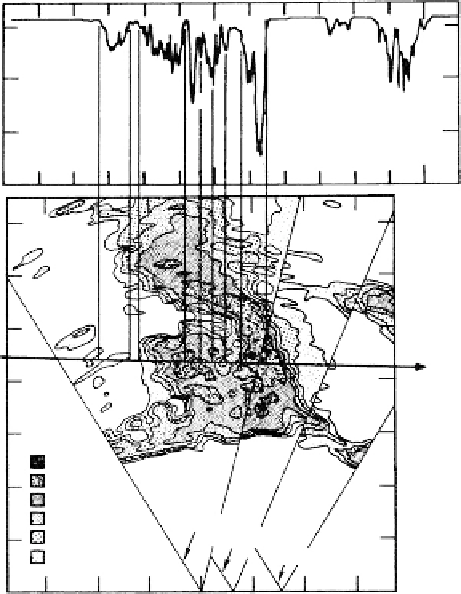
Figure 4.3b
Simultaneous horizontal satellite plasma density profile and backscatter
map made with the Altair radar. [After Tsunoda et al. (1982). Reproduced with permis-
sion of the American Geophysical Union.]
Search WWH ::

Custom Search