Geoscience Reference
In-Depth Information
JULIA radar at Jicamarca
30
800
20
600
10
400
0
200
19
19.5
20
20.5
21 21.5
Hours LT 1996/09/06
22
22.5
23
23.5
150
800
100
50
600
0
400
250
2
100
2150
200
19
19.5
20
20.5
21 21.5
Hours LT 1996/09/06
22
22.5
23
23.5
200
800
100
600
0
400
2100
200
2
200
19
19.5
20
20.5
21 21.5
Hours LT 1996/09/06
22
22.5
23
23.5
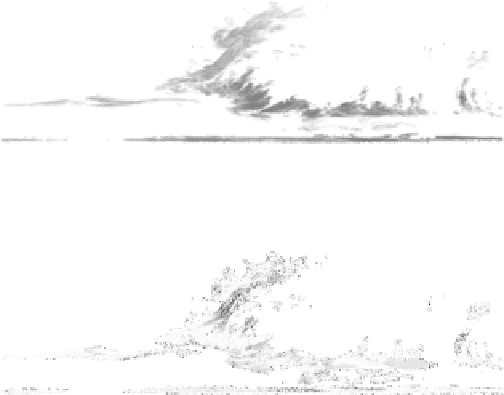
Figure 4.2
An RTI map for September 6, 1996, is reproduced in the top panel. In the
central panel the map is color scaled to represent the vertical line-of-site velocity of the
irregularities. In the lower panel the east-west velocity is represented. [After Hysell and
Burcham (1998). Reproduced with permission of the American Geophysical Union.] See
Color Plate 3.
antiparallel to the magnetic field) if the irregularities are frozen into a medium
that moves with that constant velocity. Since the probing radar wavelength is
very small compared to the scales involved in the phenomena, they can be consid-
ered as tracers, but care must be taken in the interpretation of the observed fea-
tures in these maps. Nonetheless, the inspired interpretation made by Woodman
and LaHoz (1976) that the plumes represent upwelling of plasma “bubbles”
has stood the test of time and is consistent with in situ data from rockets and
satellites.


Search WWH ::

Custom Search