Geoscience Reference
In-Depth Information
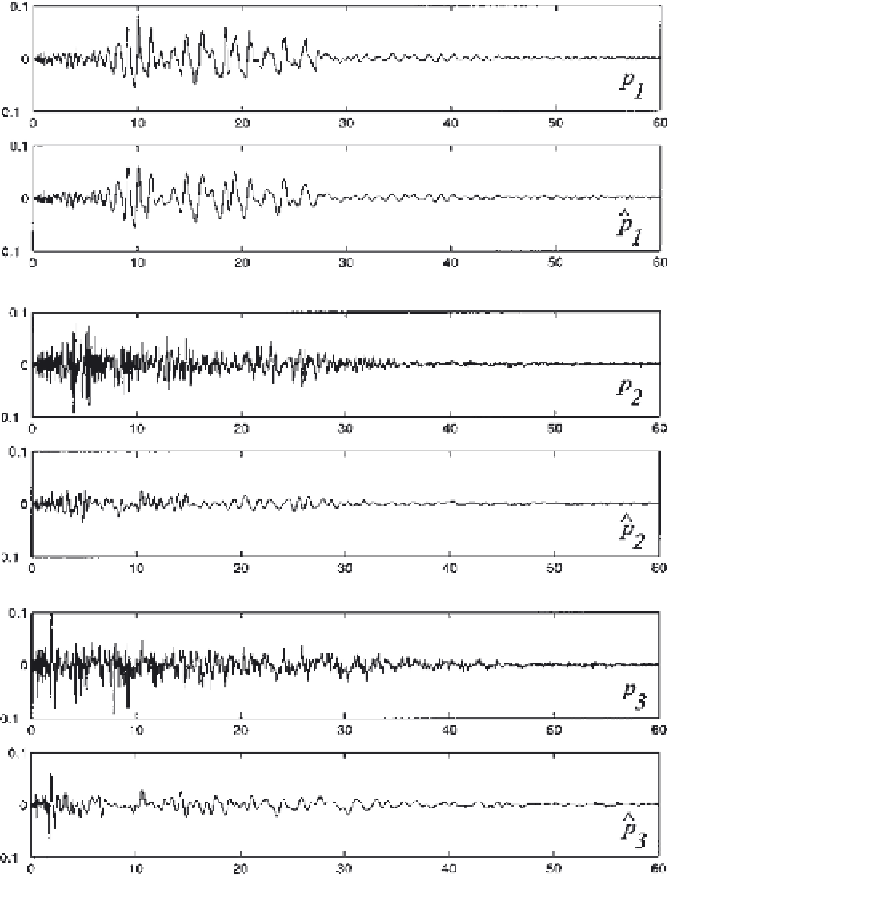
Figure 5
Comparison of the first three analytically approximated ˆ
k
and the exact
eigenvectors p
k
of the excitation process covariance matrix. These are ordered
corresponding to the magnitude of the corresponding eigenvalue; that is, p
1
represents
the eigenvector with the most energy.


Search WWH ::

Custom Search