Geoscience Reference
In-Depth Information
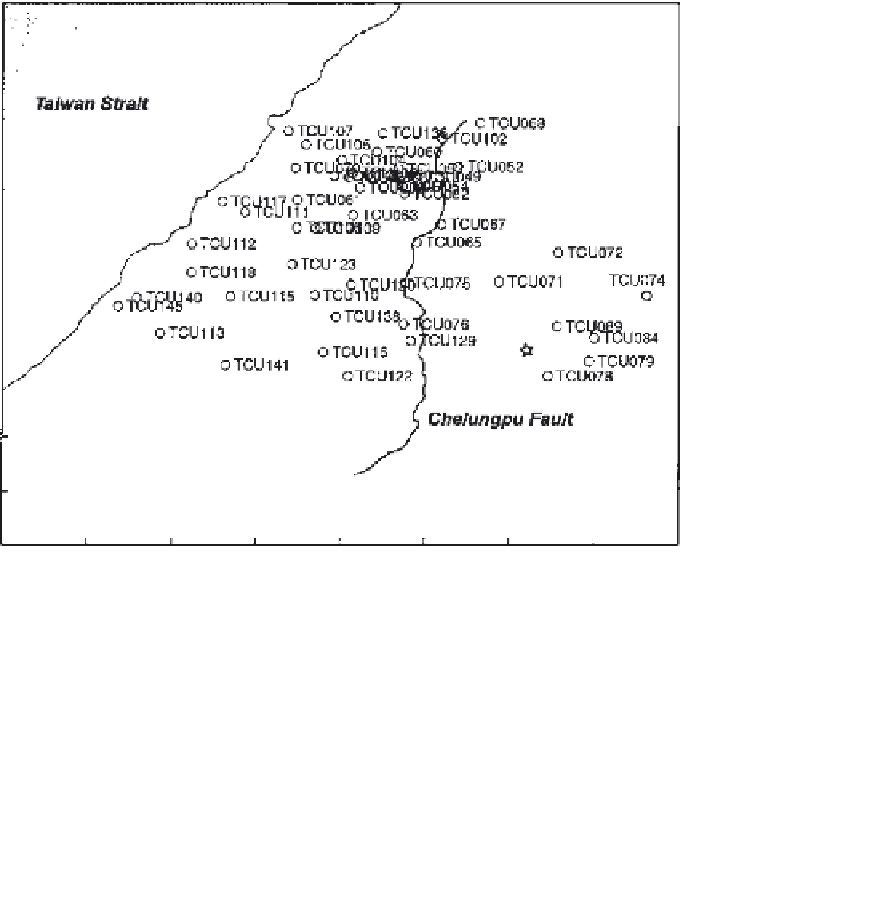
Figure 1
Map indicating the TCU ground motion recording sites relative to the
Chelungpu Fault and the Chi-Chi earthquake epicenter.
200 Hz to 50 Hz so that simulations could be run relatively quickly on standard
desktop PCs. The duration of the records used to create the ensemble was 60 sec,
thus yielding records with 3000 samples. Each of the records was synchronized
by a trigger level of 0.1%g in horizontal acceleration at a given station. All three
directions of acceleration were included in the ensemble for demonstration
purposes. The covariance matrix of the data ensemble is shown in
Fig. 3.
The
nonstationary character of the data set is clearly visible. Using the Karhunen-
Loeve expansion, the data was spectrally decomposed. The convergence rate of
the 153 nonzero eigenvalues is shown in
Fig. 4
.
3 CONDENSATION AND ANALYTICAL APPROXIMATION
OF EXCITATION DATA
The first stage of the data compaction procedure cited earlier involves the K-L
expansion and truncating the series representation to include the most dominant


Search WWH ::

Custom Search