Geoscience Reference
In-Depth Information
2. Stiffness and strength values were recalculated under the new stress
state,
3. To simulate compaction, a surcharge load of 20 kN/m
2
(tapered to a
smaller value near the wall face) was applied at the top of the recently
placed lift of soil and the system again brought to equilibrium, and
again the stiffness and strength properties were updated,
4. The load was removed and once again the system brought
to
equilibrium and the strength/stiffness properties were updated.
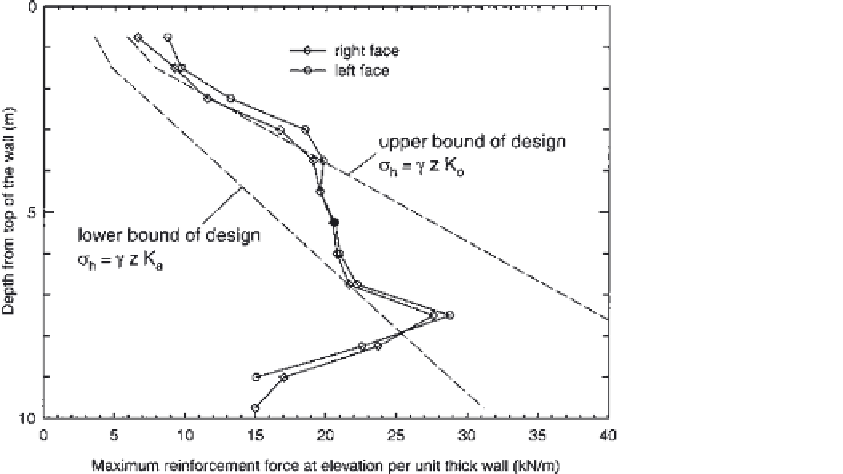
End-of-construction reinforcement forces calculated during the numerical
simulation of wall construction are shown in Fig. 6.
Maximum reinforcement forces at each elevation per unit width (into the
page) are presented. For benchmarking purposes, boundary lines are shown in the
figure that correspond to reinforcement forces from active and at-rest earth
pressures, respectively. These bounds represent the upper and lower bounds used
in conventional RE wall design (in general, static design guidelines utilize an
approach where the reinforcement forces are determined by computing lateral
earth pressures, assumed to be somewhere between active and at-rest, within a
given tributary area). Examining the figure, one can see that the maximum
Figure 6
Maximum reinforcement forces following the construction simulation relative
to the upper and lower bounds that would be used for static design.


Search WWH ::

Custom Search