Geoscience Reference
In-Depth Information
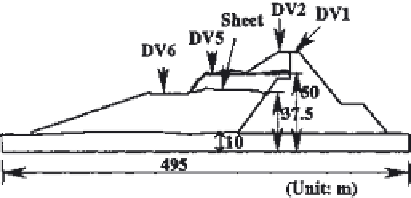
Figure 26
Large-scale land reclamation model (Case 2).
To understand the effect of reinforcement, let us look at
Table 6
,
which
compares the maximum settlement of each case at the time of 300-gal input.
Both Cases 2 and 3 showed slightly less settlement than Case 1, but looking
at DV2 in Case 2, we can see that there was a large amount of settlement for the
reinforced model. For Case 1, when the acceleration was at 320 gal, rupture
occurred. Conditions during this rupture included considerable settlement of the
sandy foundation around the crest and the occurrence of cracking. Here, the
reinforcing material i.e., sheets moved downstream as the sandy foundation
became fluid, affecting the area around the crest.
In Case 3, the original shape was kept more intact than in Case 1 for
acceleration of 320 gal. However, rupture did occur at 440 gal. In the sandy
section, there was not much settlement in the cases of nonreinforcement and
reinforcement by geogrids, while there was quite an increase in settlement with
sheeting. This was the result of either very little effectiveness of the sheet when
there was liquefaction, or increased settlement in the central (sandy) section of
the crest. Looking at the berm (DV5), more sand flowed from the upper section of
the dam when there was liquefaction than in the case of nonreinforcement (DV6),
meaning that the mechanism of “settlement” was very complex. Therefore, we
cannot evaluate the reinforcement effect from the settlement at this location.
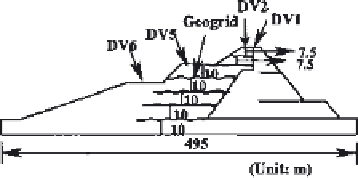
Figure 27
Large-scale land reclamation model (Case 3).


Search WWH ::

Custom Search