Geoscience Reference
In-Depth Information
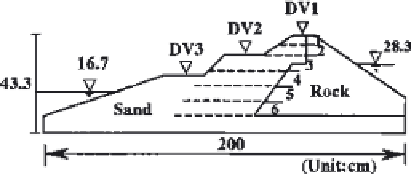
Figure 23
Small-scale shaking table test model reinforced with geogrids.
horizontally in the embankment. The numbers 0, 3, 4, or 6 were used to clear
differences in reinforcement effectiveness.
The model was constructed by depositing wet sand with underwater
deposition to obtain the required density. The input wave was a 3-Hz sine wave,
and the maximum input acceleration was about 220, 350, or 450 gal. Resonance
tests prior to the shaking test established no resonance frequency between
1-50 Hz. As the model was relatively small, geogrids with low rigidity were used
in consideration of scale effects.
The density of the rock portion was 1.90 t/m
3
, and the relative density of the
berm (DV2) to evaluate the reinforcement effectiveness. The unreinforced
portion collapsed at 220 gal, while the reinforced portion with three sheets of
geogrid collapsed at 355 gal. The test results show that the reinforcement with
geogrids was effective in preventing settlement.
Table 4
Properties of Geogrid
Mesh size (mm)
Strength (kg/m)
Open area ratio (%)
6
£
6
530
62
Table 5
Test Results in the Small Scale Shaking Table Test
Reinforced part
Case
(In Fig. 23)
Settlement at DV2
1
0
220 gal
35
460
2
1, 2, 3
42
64
-
3
1,2,3,4
0.1
10
21
4
1,2,3,4,5,6
0.4
10
21


Search WWH ::

Custom Search