Geoscience Reference
In-Depth Information
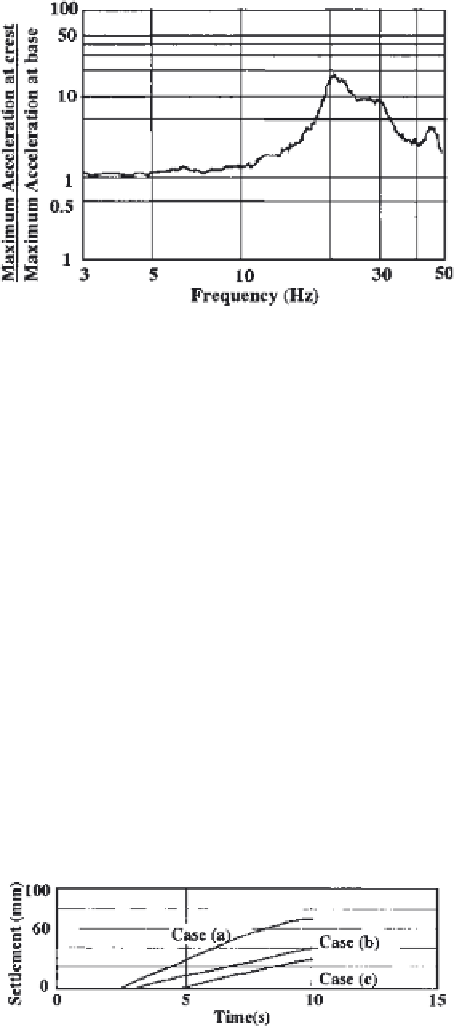
Figure 12
Resonant curve [Case (a)].
A 3-Hz sine wave was imposed for 10 sec, and the maximum input
acceleration was 150 and 250 gal. Figure 12 shows the resonant curve of the crest
in Case (a) (without reinforcement) with an input sine wave of 20 gal. The
response increased about 16 times with a frequency of 22 Hz. With a maximum
input acceleration of 150 gal, the crest settlement was 30mm in Case (b), but
there was little settlement in Case (b) and (c). At the maximum input acceleration
of 250 gal, loading for 10 sec resulted in crest settlement of more than 70 mm in
Case (a), but only 40mm in Case (b) and about 26mm in Case (c), as shown in
Fig. 13. In Case (b), the crest settlement was 60% less than without
reinforcement. In Case (c), the settlement decreased less because the sheet pile
moved and was of no use; however, settlement was still 40% less than without
reinforcement and 60% less than Case (b). The effectiveness of reinforcement
together with sheet piles may have been very good.
Figure 14
shows the input wave of 250 gal, and response acceleration at A1
three cases. The pore pressure started to increase immediately in Case (a), but
there was little increase until about 3 sec of loading with (b) and (c). This was
Figure 13
Settlement at crest (max acc.
¼
250 gal, D1).


Search WWH ::

Custom Search