Geoscience Reference
In-Depth Information
Figure 6
Input wave form at acceleration 650 gal.
A sine wave with a frequency of 10 Hz was imposed for 10 sec. The
acceleration was increased in stages to about 100, 200, 400, and 600 gal. Figure 6
shows the input wave at 650 gal; crest settlement was very small up to 400 gal.
However, at the maximum acceleration of 600 gal, both the crest settlement and
pore water pressure increased greatly, and the model without reinforcement
collapsed.
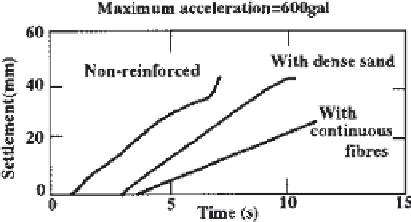
Figure 7 compares the settlement of the crest (D2) with sand A with and
without reinforcement. Five seconds after loading, the settlement with continuous-
fiber reinforcement was approximately one tenth that without reinforcement, and
about one third of the case reinforced with dense sand.
Figure 8
compares the
crest settlement with sand B. After loading for 10 sec the settlement of the case
reinforced with continuous fibers was about one fifth of the unreinforced case.
Figure 9
shows a comparison of the acceleration (A10) of specimen A, the
pore water pressure (P3), and the amount of settlement of the crown. In the case
of reinforcement, there was almost no increase in the pore water pressure 3 sec
after loading, but after 7 sec there was a rise in all cases to the respective effective
overburden pressures. The acceleration response of unreinforced materials
decreased in about 1 sec, but in the reinforced materials, an increase in
acceleration response was seen for about 4 sec. Specimen B showed similar
Figure 7
Settlement at crest D2 (sand A).


Search WWH ::

Custom Search