Geoscience Reference
In-Depth Information
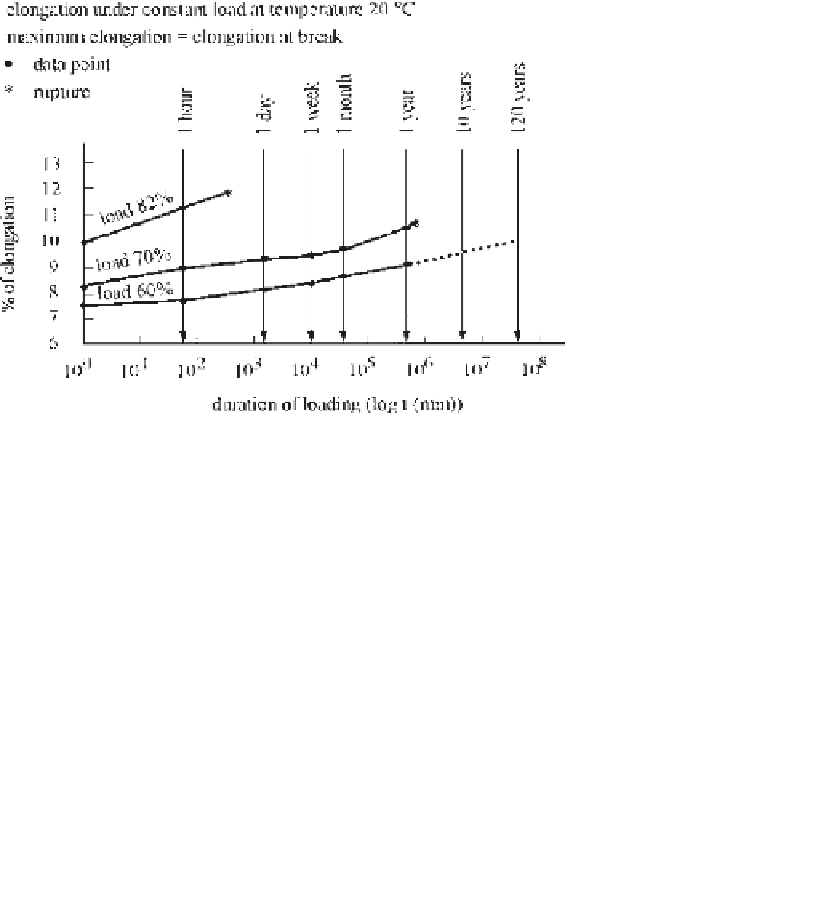
Figure 3
Typical creep graphs, Fortrac.
where
T
d
is the design strength.
T
c
is the characteristic strength above which the material fails in tension
from peak loading during the design life of the structure.
f
m
is a material factor f
m
¼
f
m1
·f
m2
;
where f
m1
¼
f
m11
·f
m12
and f
m2
¼
f
m21
·f
m22
:
The various factors f
mxx
are described in the BS 8006 and cover factors for
manufacture/control values, extrapolation of test data, susceptibility to damage,
and environment. The values of the above parameters differ for flexible and stiff
grids. Various loads factors f are used in the design to complete the ultimate
limit state design. This method complies with the approach followed in
Eurocode 7 for geotechnical designs. P
char
[t, T ]orT
c
for HDPE grids is derived
from a creep deformation limit of 10% during a design life (Jewell and
Greenwood, 1988). In the case of polyester (PET) grids, this value is obtained
from stress-rupture data produced by tests on yarns running more than 10 years
and tests on actual products running for more than 9 years now. All these data
are summarized in one stress-rupture graph, which is normalized as a
percentage of the short-term ultimate tensile strength, to give the so-called
stress-rupture graph,
in which a 95% confidence limit
indicates the
characteristic levels (Voskamp, 1990).


Search WWH ::

Custom Search