Geoscience Reference
In-Depth Information
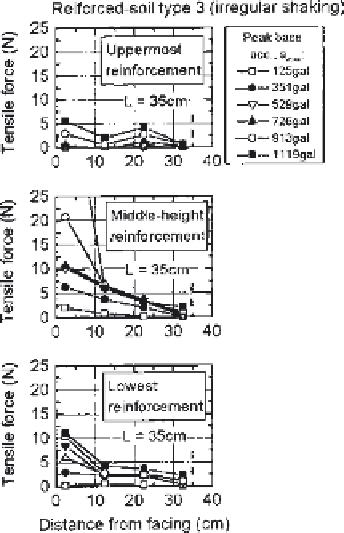
Figure 18
Horizontal distribution of
tensile forces in reinforcement
layers for
reinforced soil retaining wall type 3.
respectively. As seen from
Fig. 16
,
these values are much smaller than the peak
values measured near the facing, suggesting the effectiveness of the grid shape in
developing the tensile force in the reinforcements. On the other hand, if the effect
width of the reinforcement is assumed to be 100mm, which is equal to the
horizontal interval of the reinforcements that connected to the facing
(Fig. 3)
,
the
computed frictional resistance will become about 25 N, 125 N, and 225 N for the
uppermost, middle-height, and lowest reinforcements, respectively. These values
are substantially larger than the peak values measured near the facing (Fig. 16).
Future investigations are required to establish a procedure to quantitatively
evaluate the mobilized tensile force in the reinforcements, including actual
geogrids used in practice.
6.6 Resultant Force of Normal Earth Pressures
Relationships between the resultant force P
a
acting normally on the facing from


Search WWH ::

Custom Search