Geoscience Reference
In-Depth Information
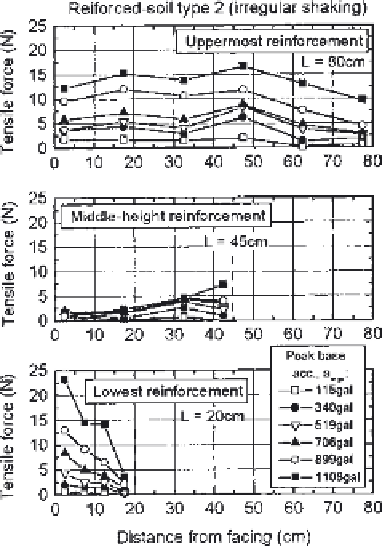
Figure 17
Horizontal distribution of
tensile forces in reinforcement
layers for
reinforced soil retaining wall type 2.
of 80 cm and 45 cm, respectively, showed different behaviors from others. The
tensile force of the uppermost reinforcement was constantly large, showing a
reduction with approaching its tip, while the tensile force of the middle-height
reinforcement was very limited. These behaviors suggest that the extended
uppermost reinforcement mobilized the frictional resistance near its tip, while the
middle-height reinforcement that was extended to a lesser extent did not mobilize
the frictional resistance effectively. Such different degrees of mobilization of
frictional
resistance may be linked to the different
locations of
these
reinforcements relative to the failure planes as typically shown in
Fig. 9
.
If it can be assumed that the frictional angle at the interface between the
reinforcement and the backfill is equal to the simple shear peak friction angle of
the backfill, f
ss
¼
arctan(t/s)
max
along a horizontal failure plane, which is
estimated to be 38
as shown later, the frictional resistance mobilized on both
sides of the reinforcement having a width of 3mm over its full length (
8
200mm;
refer to the hatched zone in
Fig. 3
)
for reinforced soil type 1 will become about 0.8
N, 3.8 N, and 6.8 N for the uppermost, middle-height, and lowest reinforcements,
¼


Search WWH ::

Custom Search