Geoscience Reference
In-Depth Information
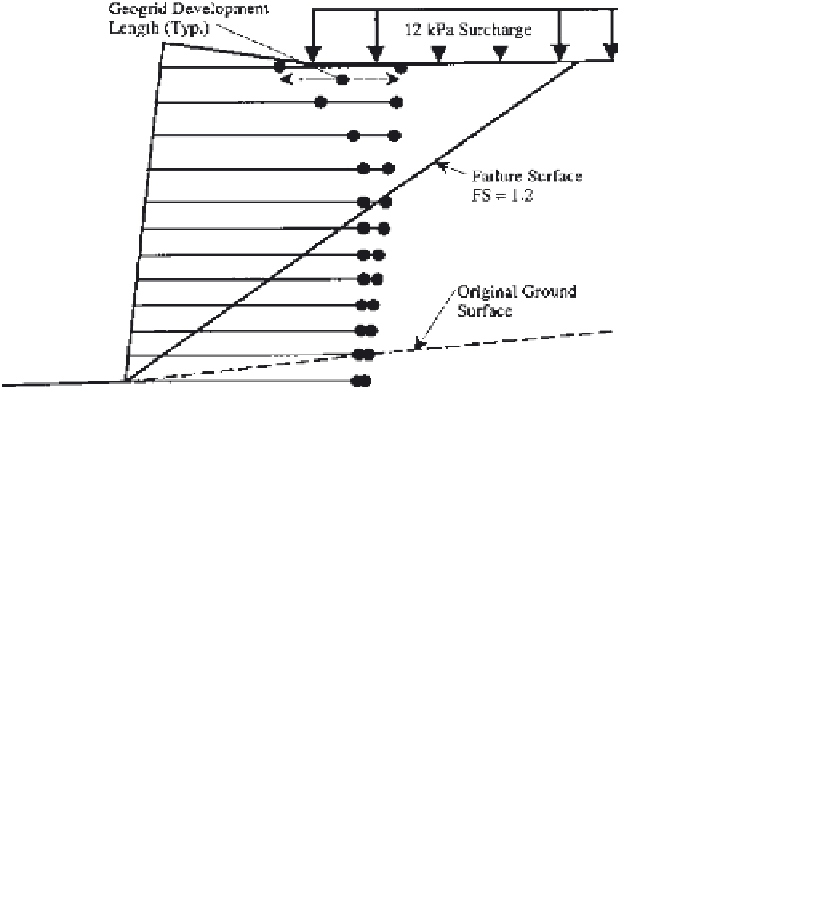
Figure 6
Slope stability output using field data.
5 BACK ANALYSIS
The original wall design was reanalyzed using the data obtained from the field
investigation of both collapses in an attempt to determine the cause of the failure.
A parametric evaluation was conducted varying the unit weight, effective friction
angle, and coefficient of interaction. A compound failure resulted in the lowest
factors of safety.
A factor of safety of about 1.17 was estimated using the unit weights
measured in the field, the effective friction angle measured from direct shear
tests, and a lower coefficient of interaction to account for the high-moisture-
content silts. An example output for this case is included in Fig. 6.
The parameters were then varied to get a factor of safety of 1.0. An
effective friction angle of 25
was required to achieve a factor of safety of 1.0;
however, the failure surface did not approximate the field observed conditions.
When a water table was added using a friction angle of 28
8
, the failure surface
more closely approximated the observed field behavior. All of the failure surfaces
passed through several layers of the geogrid reinforcement. This indicates that a
break or pullout of the grid occurred. There was no evidence of a break in the
grids at the base of the wall after failure, and not enough movement occurred to
evaluate if the grids pulled out of the back of the reinforced zone. Also, tearing of
the grid is not considered to be a probable cause of failure since the creep limited
strength was used in the analysis rather than the ultimate strength, which is about
300% higher. An example output for this analysis is included in
Fig. 7
.
8


Search WWH ::

Custom Search