Geoscience Reference
In-Depth Information
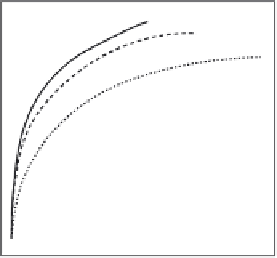
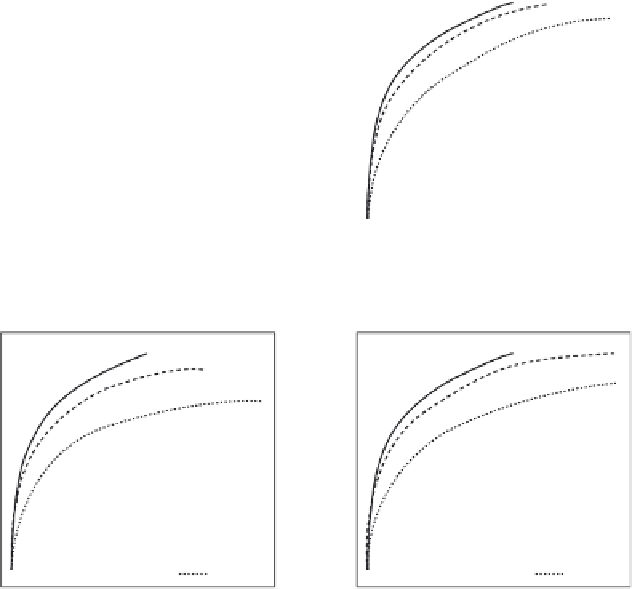
Growth curves control
Growth curves prey seeking
Maximum model size
Maximum model size
2
2
0
0
-
2
-
2
Starting from
Starting from
(500,500)
(450,450)
(400,400)
-
4
-
4
(500,500)
(450,450)
(400,400)
0
5
10
15
20
0
5
10
15
20
Time (yrs)
Time (yrs)
Growth curves predator avoiding
Growth curves both behaviours
Maximum model size
Maximum model size
2
2
0
0
-
2
-
2
Star
ting from
(500,500)
(450,450)
(400,400)
Star
ting from
(500,500)
(450,450)
(400,400)
-
4
-
4
0
5
10
15
20
0
5
10
15
20
Time (yrs)
Time (yrs)
Figure 3
Growth curves for individuals with different behavioural movement. All
individuals start at 5 mg, and curves are shown for three different starting positions.
slope
0.5%). Slopes in the outer region
are, however, more sensitive to changes in movement behaviour (slope
¼
1.04
1%, intercept
¼
5.53
¼
1.28
43%, intercept
¼
11.43
17%).
D. Consequences of Adding Abiotic Movement
The consequences of simulated turbulence (abiotic movement) on size spec-
tra and life-history parameters are quite trivial with average values differing
from the control by less than 5% in all cases (
Table 3
). However, the variance
of the metrics (slope, intercept, etc.) did increase with increased variability in