Geoscience Reference
In-Depth Information
A
B
Mortality
E
n
ergy cost of predation
Mortality
E
n
ergy cost of predation
20
0.8
0.8
80
15
60
40
10
0.4
0.4
5
20
0.0
0
0.0
0
1
2345678
1
2345 678
1
2345678
1
2345678
Available resource
DMR
Available Resource
DMR
1.4e+14
1.4e + 14
13
11.0
-
0.75
12
-
0.75
10.0
11
1.0e+14
1.0e + 14
10
9.0
-
0.75
9
6.0e + 13
6.0e+13
8
8.0
1
2345678
1
2345678
1
2345678
1
2345678
C
D
Mortality
E
n
ergy cost of predation
Mortality
E
n
ergy cost of predation
80
0.8
0.8
80
60
40
60
40
0.4
0.4
20
20
0.0
0
0.0
0
1
2
34567
8
1
2345678
1
2345678
1
2345678
Available resource
DMR
Available Resource
DMR
1e + 16
8e+15
11.5
12.0
11.0
6e + 15
4e+15
11.0
10.5
10.0
0e+00
10.0
2e + 15
1
2345678
1
2345678
1
2345678
1
2345678
E
F
Mortality
Energy cost of predation
Mortality
Energy cost of predation
100
1.0
100
80
0.8
80
0.8
60
40
0.6
60
40
0.4
0.4
20
0.2
20
0.0
0
0.0
0
1
2345678
1
234 56 78
1
2345678
1
2345678
Available resource
DMR
Available Resource
DMR
16
-
0.75
-
0.77
14
-
2.3
9.95e + 16
14
1.2e + 17
-
1.75
12
12
-
0.75
-
0.9
10
10
9.80e + 16
9
8.0e + 16
1
2345678
1
2345678
1
2345678
1
2345678
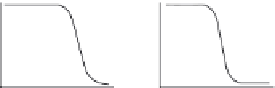
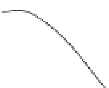
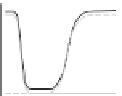
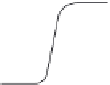
Figure 2
Effects of variation in resource availability and predation pressure by gape
limitation on the DMR. The four graphs in each panel indicate the association
between body size and mortality, its effect on energetic units (how much energy is
required to maintain one individual in the population), available resources,
and density. (A) When predation and resources do not change with body size the
energetic equivalence rule (EER) holds. (B) Step variations in mortality produce
DMRs with
0.75 exponents separated by a region with a positive association. The
dotted line is the value of body mass at which mortality is half its maximum value.
(C) Both predation and mortality change with body size; different modes are expected
as well as large variations in the scaling exponent. (D) Small variations in predation
and resources with body size lead to non-linear DMR. (E) Both smaller and larger
individuals experience heavy predation from different kind of consumes, producing
discrete scaling regimes with contrasting slopes. The grey line represents the fit of a
segmented regression from which scaling exponents were estimated. (F) The increase
in predation with body size could produce steeper DMRs and different scaling