Geoscience Reference
In-Depth Information
10
Species
8
6
4
2
0
5
10
15
B
150
Individuals
100
50
0
0
5
10
15
20
C
1.0
Proportion of resource available
at a given size
0.8
0.6
0.4
0.2
0
0
5
10
15
20
Log
2
(Volume mm
3
´
10
6
)
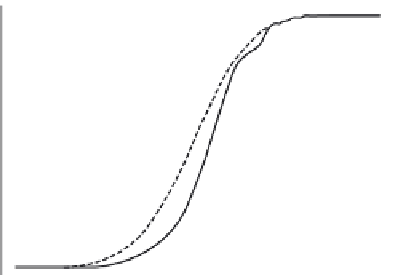
Figure 1
Frequency distribution of species (A) and individuals (B) in a temporal
pond metacommunity. Gape limitation determines that only those individuals smaller
than a fraction of predator body size can be consumed. In a wide range of predator
body sizes, the proportion of prey that can be consumed is progressively incremented.
The solid line in the last panel (C) indicates the proportion of the total distribution of
individuals that can be consumed by a predator that can feed until a particular prey
size. The dashed line is the cumulative probability of a normal distribution with mean
and variance estimated from data in panel B.