Geoscience Reference
In-Depth Information
Random
Mass up
Mass down
Gen up
Gen down
Vul up
Vul down
200
150
100
50
0
0.0
0.2
0.4
0.6
0.8
1.0
Robustness
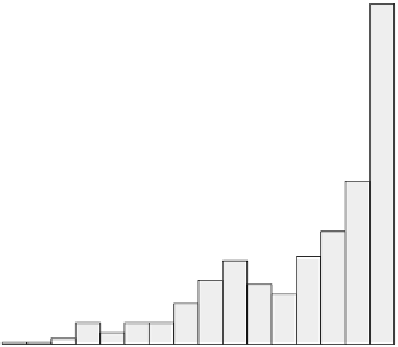
Figure 7
A histogram of the values of robustness for the 1000 random extinction
orders. The coloured circles represent the three extinction orders, which resulted
in secondary extinctions. The value of robustness was calculated by the method
described in the text.
B. The Weddell Sea Food Web and Functional Consumer
Classification
With the relatively low level of direct human impact, the Antarctic has been
identified as an important case study for the conservation of intact ecosys-
tems (
Chown and Gaston, 2002
). Certain aspects of the ecology of Antarctic
organisms have been reviewed regularly during the past (
Arntz et al., 1994;
Clarke and Johnston, 2003; Dayton, 1990
), but with respect to the whole
system, deciding where to begin to characterise communities and ecosystems
remains a challenging issue; we still do not know how many species are
present, although incidence-based coverage estimators of species richness
range between 11,000 and 17,000 species (Gutt et al., 2004;
Clarke and
Johnston, 2003
). It is even more uncertain as to how these species all interact,
so any attempts to characterise local food webs represent important advances
in our understanding of Antarctic ecology.
Despite being far from complete (489 species vs. 17,000 potential species),
the Weddell Sea food web dataset presented here differs from many other