Geoscience Reference
In-Depth Information
25
15
5
0
SC: 7
SC: 8
SC: 9
SC: 10
SC: 11
25
15
5
0
SC: 12
SC: 13
SC: 14
SC: 15
SC: 16
25
15
5
0
SC: 17
SC: 18
SC: 19
SC: 20
SC: 21
25
15
5
0
SC: 22
SC: 23
SC: 24
SC: 25
SC: 26
25
15
5
0
0
50
150
0
50
150
0
50
150
0
50
150
SC: 27
25
15
5
0
0
50
150
Number of samples
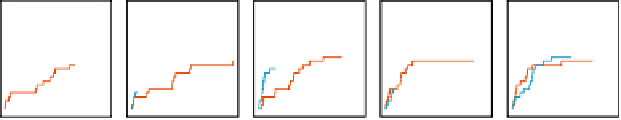
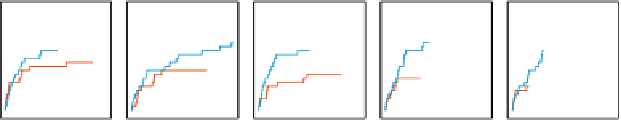
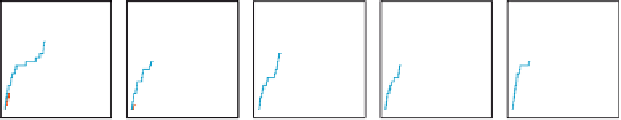
Figure A3
Yield-effort curves for the 26 size classes in Broadstone Stream contain-
ing individual predators or prey. Red (dark) curves show the cumulative out-degree
(vulnerability) and blue (light) curves show the cumulative in-degree (generality)
as functions of the number of prey or predator individuals sampled within a size
class, respectively. Individuals are sampled in order of increasing size within their
size class. The dashed lines denote the theoretical maximum in- or out-degree for a
size class, assuming size classes only feed on size classes smaller or equal to itself in
size.