Geoscience Reference
In-Depth Information
Afon Hirnant
Broadstone Stream
Celtic Sea
Coilaco River
Guampoe River
Trancura River
Tadnoll Brook
2
2
d
=
-7.64,
r
2
=
0.40,
d
=
-5.06,
r
2
=
0.31,
df
=
32,
p
=
0.005
d
=
2.50,
r
2
=
0.18,
df
=
56,
p
=
0.383
d
=
-4.28,
r
2
d
=
-2.49,
r
=
0.32,
df
=
24,
p
=
0.294
d
=
-6.09,
r
=
0.19,
df
=
52,
p
=
0.140
d
=
-4.88,
r
2
=
0.14,
df
=
41,
p
=
0.052
=
0.09,
df
=
74,
p
=
0.067
30
df
=
42,
p
=
0.000
20
10
0
d
=
-17.37,
r
2
=
0.24,
df
=
74,
p
=
0.000
d
=
-22.21,
r
2
=
0.87,
df
=
24,
p
=
0.000
d
=
-45.67,
r
2
=
0.64,
df
=
52,
p
=
0.000
d
=
-12.75,
r
2
=
0.45,
df
=
42,
p
=
0.000
d
=
-15.76,
r
2
=
0.50,
df
=
41,
p
=
0.000
d
=
-6.04,
r
2
=
0.31,
df
=
32,
p
=
0.001
d
=
-52.63,
r
2
=
0.56,
df
=
56,
p
=
0.000
30
20
10
0
−6
−2
2
6
−6
−2
2
6
−6
−2
2
6
−6
−2
2
6
−6
−2
2
6
−6
−2
2
6
−6
−2
2
6
log
10
(focal mass)
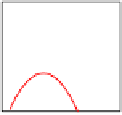
Figure 12
Out-degree (vulnerability) versus species average log
10
body mass, per system. Upper row shows taxonomic groupings (D*),
and lower row shows size-class groupings (F*). The trend lines are the fitted OLS quadratic regression, where the parameter d is the
second-order coefficient.