Geoscience Reference
In-Depth Information
B
A
Individual level (A)
Species average (D)
Broadstone Stream (Br)
Celtic Sea (Ce)
Afon Hirnant (Af)
Tadnoll Brook (Ta)
Guampoe River (Gu)
Trancura River (Tr)
Coilaco River (Co)
6
6
4
4
Ce
2
2
Ce
0
0
Br
Ta
Ta
Gu
−2
−2
Br
Co
Gu
Af
Co
Tr
Af
Tr
−6
−6
−4
−2
0
2
4
6
−4
−2
0
2
4
6
log
10
(predator mass)
Species average log
10
(predator mass)
C
D
Link average (C)
Size class binned (F)
6
6
4
4
Ce
2
Ce
2
0
0
Br
Ta
Ta
Br
−2
−2
Gu
Gu
Co
Co
Af
Af
Tr
Tr
−6
−6
−4
−2
0
2
4
6
−4
−2
0
2
4
6
Link average log
10
(predator mass)
log
10
(predator size class mass)
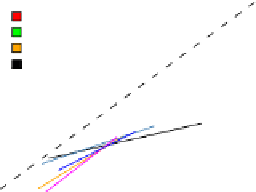
Figure 5
Prey mass versus predator mass, all systems together. (A-D) show feeding
events for the individual-level data (resolution A), species averages (resolution D),
link averages (grouping C) and size classes (grouping F), respectively. The trend lines
show the LMM prey mass-predator mass response variable per study system (identi-
fied by colour/abbreviation of study system). The dashed line indicates the 1:1 line,
that is, where prey size equals predator size.
of 0.305, t
0.007,
Figure 4
D). Thus, at the lower resolu-
tion, predators appear to increase in size relatively faster than their prey than
would be perceived at the higher resolution.
¼
3.967, df
¼
6, p
¼
d. Predator Mass-Predator-Prey Mass Ratio (Grouping). Again, an
LMM was used, with only predator species identity included as a random
effect (
Figure 6
C and D). The paired t-test showed that the size-class-based


