Geoscience Reference
In-Depth Information
Table 13.4.
Number of wind, water, and sunlight (WWS) power plants or devices needed to provide the world
and U.S. total end-use power demand in 2030 (11.5 and 1.8 TW, respectively, from Table 13.2)
Rated
power of
one plant/
device
(MW)
Percent of
2030 power
demand
met by
plant/device
Footprint
area
(percent
of global
land area)
Spacing
area
(percent of
global
land area)
Number of
plants/devices
needed
worldwide
Number of
plants/devices
needed in
United States
Energy
technology
Wind turbine
5
50
3.8 million
0.000033
1.17
590,000
Wave device
0.75
1
720,000
0.00026
0.013
110,000
Geothermal plant
100
4
5,350
0.0013
0
830
Hydroelectric plant
1,300
4
900
a
0.407
a
0
140
a
Tidal turbine
1
1
490,000
0.000098
0.0013
7,600
Roof PV system
0.003
6
1.7 billion
0.042
b
0
265 million
Solar PV plant
300
14
40,000
0.097
0
6,200
CSP plant
300
20
49,000
0.192
0
7,600
TOTAL
100
0.74
1.18
TOTAL NEW LAND
0.41
c
0.59
c
This table assumes the given fractionation of demand among plants or devices while accounting for transmission, distribution, and array
losses. Also shown are the footprint and spacing areas required to power the world as a percentage of the global land area, 1.446
×
10
8
km
2
.CSP, concentrated solar power; PV, photovoltaic.
a
About 70 percent of the hydroelectric plants are already in place. See Jacobson (2009) for a discussion of apportioning the hydroelectric
footprint area by use of the reservoir.
b
The footprint area for rooftop solar PV does not represent an increase in land because the rooftops already exist and are not used for
other purposes.
c
Assumes that 50 percent of the wind is over water, and wave and tidal are in water; 70 percent of hydroelectric is already in place; and
rooftop solar does not require new land.
Source:
Jacobson and Delucchi (2011).
0.12
6000
V
m
=7.5 m s
-1
Rated power
5000
0.1
0.08
4000
3000
0.06
0.04
2000
1000
0.02
0
0
0
5
10
15
20
25
30
35
0
5
10
15
20
25
30
35
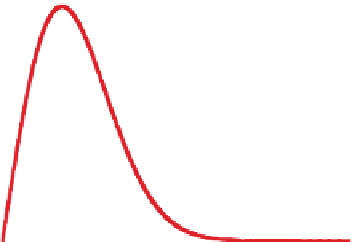
(b) Wind speed (m/s)
(a) Wind speed (m/s)
Figure 13.14.
(a) Power curve for an RE Power wind turbine rated at 5,000 kW (5 MW). The curve shows the
power output of the turbine as a function of instantaneous wind speed. The turbine rotor diameter is 126 m,
and the hub height is 100 m above the surface. The cut-in wind speed is 3.5 m s
−1
,therated wind speed is
13 m s
−1
,andthecut-out wind speed is 30 m s
−1
.From Archer and Jacobson (2007). (b) Rayleigh probability
distribution of wind speed when the mean wind speed is 7.5 m s
−1
.


Search WWH ::

Custom Search