Geoscience Reference
In-Depth Information
35000
50
30000
40
Nuc-BEV 641-2181-27,681
30
25000
20
20000
10
15000
0
-10
10000
-20
5000
-30
0
(a)
(b)
20000
Corn-E85 12,200-17,000
15000
+7.2
Hydro-BEV 5800-13,200
10000
5000
0
(c)
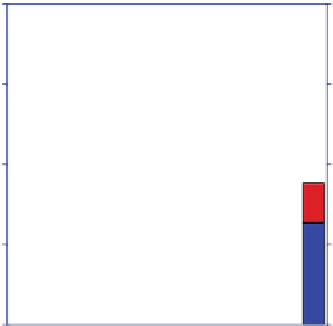
Figure 13.1.
(a) Percent changes in U.S. CO
2
(g) emissions upon replacing 100 percent of on-road (light- and
heavy-duty) vehicles powered by fossil fuels with vehicles powered by different energy technologies. The
maximum possible percent reduction in CO
2
(g) due to such a conversion is 32.7 percent because 26 percent of
U.S. CO
2
(g) originates from vehicle exhaust and 6.7 percent from upstream fuel production. Low and high
estimates are given. In all cases except the E85 cases, blue represents the low estimate and blue plus red, the
high. For corn and cellulosic E85, the full bars represent the range at 100 percent penetration, and the brown
bars represent the range at 30 percent penetration. For both ethanol sources, the high estimate occurs when
emissions associated with price changes of fuel crops are accounted for. Such emissions occur when the price
of corn increases due to its use as a fuel instead of food, and this triggers a conversion of forested or densely
vegetated grassland to agricultural land, increasing carbon emissions (e.g., Searchinger et al., 2008).
(b) Estimates of 2020 U.S. premature deaths per year due to emissions from the production and use of energy
for vehicles and exhaust from vehicles (where applicable) for the scenario in (a). Low (blue) and high (blue plus
red) estimates are given. In the case of nuc-battery electric vehicles (BEVs powered by electricity from nuclear
plants), the additional brown bar represents the upper limit of the potential number of deaths, scaled to the
U.S. population, due to one potential nuclear weapons catastrophe over 30 years in a megacity caused by the
proliferation of nuclear energy facilities worldwide. In the case of corn E85 and cellulosic E85, the red bar is
the additional number of deaths due to tailpipe emissions of E85 over gasoline for the United States (Section
4.3.8), and the black bar is the additional number of U.S. deaths per year due to upstream emissions from
producing and distributing E85 fuel minus those from producing and distributing gasoline. The estimated
number of deaths for gasoline vehicles in 2020 is also shown. (c) Low (blue) and high (blue plus red) estimates
of water consumption (gigagallons/year, where 1 gigagallon
10
9
gallons) required to replace all U.S. on-road
vehicles with different vehicle technologies. Consumption is net loss of water from water supply. For
comparison, the total U.S. water consumption in 2000 was 148,900 gigagallons/year. From Jacobson (2009).
=


Search WWH ::

Custom Search