Geoscience Reference
In-Depth Information
emissions from, for example, vehicles are continuous
rather than pulse emissions. GWP also does not account
for feedback from one pulse to another because it does
not account for multiple pulses. Furthermore, whereas
the time average of instantaneous direct radiative forc-
ing is relatively proportional to temperature changes for
greenhouse gases, it is not proportional for aerosol par-
ticles; thus, the GWP does not give accurate information
about the climate effects of aerosol particles. However,
GWP is somewhat similar to STREs for greenhouse
gases. For example, the 20- and 100-year GWPs for
CH
4
(g) from IPCC (2007) are 72 and 25, respectively.
This compares with STREs for CH
4
(g) of 52 to92and
29 to 63, respectively (Table 12.6).
Table 12.6 indicates that the STRE of FS is greater
than that of BSG. The reason is that BSG has a much
higher ratio of POC to BC than does FS, and POC causes
much less heating than does BC. Also, BSG contains
other material aside from BC and POC, such as sul-
fate, nitrate, ammonium, potassium, and magnesium,
all of which cause cooling; thus, they offset much of
the warming due to the BC and POC. As such, control-
ling a unit continuous emission of FS has a greater
impact on reducing temperatures than does control-
ling a unit continuous emission of BSG. Because both
STREs are much larger than are STREs of CH
4
(g) or
0.2
0
Methane
-0.2
Fossil-fuel soot
-0.4
-0.6
Fossil-fuel soot +
biofuel soot & gases
-0.8
-1
CO
2
-30 yr
-1.2
CO
2
-50 yr
-1.4
2000
2020
2040
2060
2080
2100
Year
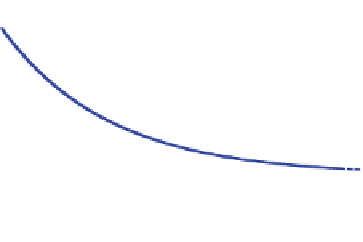
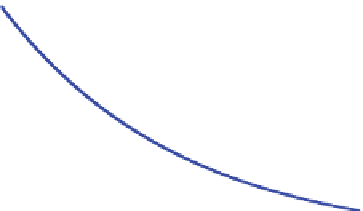
Figure 12.33.
Estimated changes in globally averaged
near-surface air temperature resulting from the
elimination of all continuous anthropogenic emissions
of each CO
2
(g), methane, fossil fuel soot, and fossil
fuel soot plus biofuel soot and gas between 2000 and
2100, from Jacobson (2010b). In the case of CO
2
(g),
results bounding the data-constrained lifetimes of 30
to 50 years are shown. The lifetime of methane is
approximately 10 years. That of fossil fuel soot and
solid biofuel soot is about 4.5 days. Because of soot's
short lifetime, the elimination of its emission cools
climate quickly, but a slow climate response by the
oceans to atmospheric temperatures results in its
removal affecting temperatures over a longer period.
Emission rates for the figure are as follows: carbon
dioxide,
10,200 Tg-C yr
−1
from fossil fuels and
permanent deforestation in 2010; methane, 263 Tg-C
yr
−1
in 2005; solid biofuel soot, 2.5 Tg-C yr
−1
BC plus
9.9 Tg-C yr
−1
POC; fossil fuel soot, 3.4 Tg-C yr
−1
BC
plus 2.4 Tg-C yr
−1
POC (Bond et al., 2004). BC, black
carbon; POC, primary organic carbon.
∼
Table 12.6.
20- and 100-year surface temperature
response per unit emission (STRE) functions for fossil
fuel soot (FS), biofuel soot and gas (BSG), black
carbon (BC) in FS or BSG, and methane
X
20-year STRE
100-year STRE
Carbon dioxide has the highest emission rate, followed
by methane among the chemicals in Figure 12.33.
The
surface temperature response per unit emission
(STRE)
of chemical X is the cumulative average near-
surface air temperature change after 20 or 100 years
per unit continuous emission of the chemical relative to
the same for CO
2
(g). The STRE is similar to another
metric, the
global warming potential (GWP)
,which
is the 20- or 100-year integrated instantaneous direct
radiative forcing change resulting from a pulse emis-
sion of a chemical relative to the same for CO
2
(g). An
instantaneous
direct radiative forcing
is an instanta-
neous net downward solar plus thermal-IR radiation
change (W/m
2
), usually evaluated at the tropopause,
when a component is present versus absent. The STRE
is a more physical metric than is the GWP because
FS
2,400-3,800
1,200-1,900
BC in FS
4,500-7,200
2,900-4,600
BSG
380-720
190-360
BC in BSG
2,100-4,000
1,060-2,020
Methane
52-92
29-63
The STRE is defined as the near-surface air temperature change
after 20 or 100 years per unit continuous emission of X relative to
the same for CO
2
(g). For comparison, the 20- and 100-year global
warming potentials (GWPs) for methane from IPCC (2007) are
72 and 25, respectively. Multiply the STRE in the table by 12/44
to obtain the STRE relative to CO
2
(g)-C. The calculations are
derived from Figure 12.33 and assume a continuous CO
2
(g) emis-
sion rate from fossil fuels plus permanent deforestation of 29,700
Tg-CO
2
(g) yr
−
1
, 284 Tg-CH
4
(g)/yr, 5.8 Tg-C yr
−
1
FS (BC
+
POC), and 12.4 Tg-C yr
−
1
BSG (PC
+
POC).
Source:
From Jacobson (2010b).


Search WWH ::

Custom Search