Geoscience Reference
In-Depth Information
0.7
300
South Coast
North Central Coast
S.F. Bay Area
San Joaquin Valley
South Coast
North Central Coast
S.F. Bay Area
San Joaquin Valley
0.6
250
0.5
200
0.4
150
0.3
100
0.2
50
0.1
0
0
1975 1980 1985 1990 1995 2000 2005 2010
2000
2005
2010
(a) Year
(b) Year
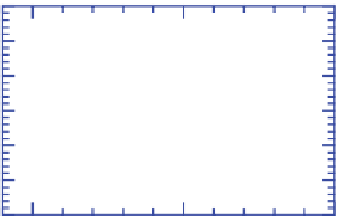
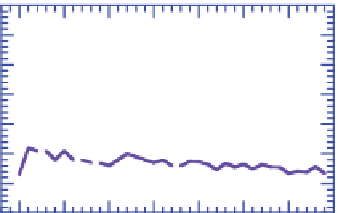
Figure 8.3.
Trends in (a) maximum hourly ozone and (b) maximum annual PM
2.5
in four California Air Quality
Control Regions. From California Air Resources Board (2011).
the U.S. population increased from 226.5 to 307.0 mil-
lion (
the demand for researchers devoted to studying and
mitigating air pollution and climate problems.
35.5 percent), the gross domestic product (GDP)
increased from $2.77 to $14.26 trillion (
+
415 per-
cent), and the per capita GDP increased from $12,200
to $46,500 (
+
8.1.16. Visibility Regulations and Trends
In the United States, California first set a
visibility
standard
in 1959 and modified it in 1969. The 1969
standard required that the prevailing visibility outside
Lake Tahoe exceed 10 miles (16.09 km) when the rela-
tive humidity was less than 70 percent. In Lake Tahoe,
the minimum allowable visibility was set to 30 miles
(48.3 km). Measurements were made by a person look-
ing for landmarks a known distance away. The furthest
landmark that could be seen along 180 degrees or more
of the horizon circle, not necessarily in continuous sec-
tors around the circle, defined the prevailing visibility.
Because prevailing visibility is a subjective mea-
sure of visibility, the California Air Resources Board
changed the California visibility standard in 1991 to
one based on the use of the meteorological range. The
revised standard required that the meteorological range
+
280 percent). Simultaneously, maximum
annual ozone levels decreased from 100.5 ppbv in
1980 to 69 ppbv in 2009 (
31 percent) (Figure 8.1).
These data suggest that
air pollution regulations did
not correlate with damage to the overall economy dur-
ing this period
.Instead, air pollution regulation led to
inventions and overall job growth in new or expanded
industries. Areas of invention included air pollution
control, engine, renewable energy, and improved fuel
technologies. New or expanded industries included the
renewable energy, pollution control device, pollution
measurement device, pollution remediation, pollution
software, and pollution modeling industries. Regula-
tions also resulted in the employment of public and edu-
cational sector workers in the areas of pollution/climate
regulation, policy, science, and engineering, and led to
the expansion of the supercomputer industry to satiate
−
10
4
10
Formaldehyde
1000
Iron
Toluene
1
Acetald-
ehyde
100
Copper
Benzene
10
Lead
m/p-xylene
1,3-butadiene
Mer
cu
ry
0.1
1
1990
1995
2000
2005
2010
1990
1995
2000
2005
2010
(b) Year
(a) Year
Figure 8.4.
Trends in average California (a) mixing ratios of selected organic gases and (b) concentrations of
selected metals in the air. From California Air Resources Board (2011).


Search WWH ::

Custom Search