Geoscience Reference
In-Depth Information
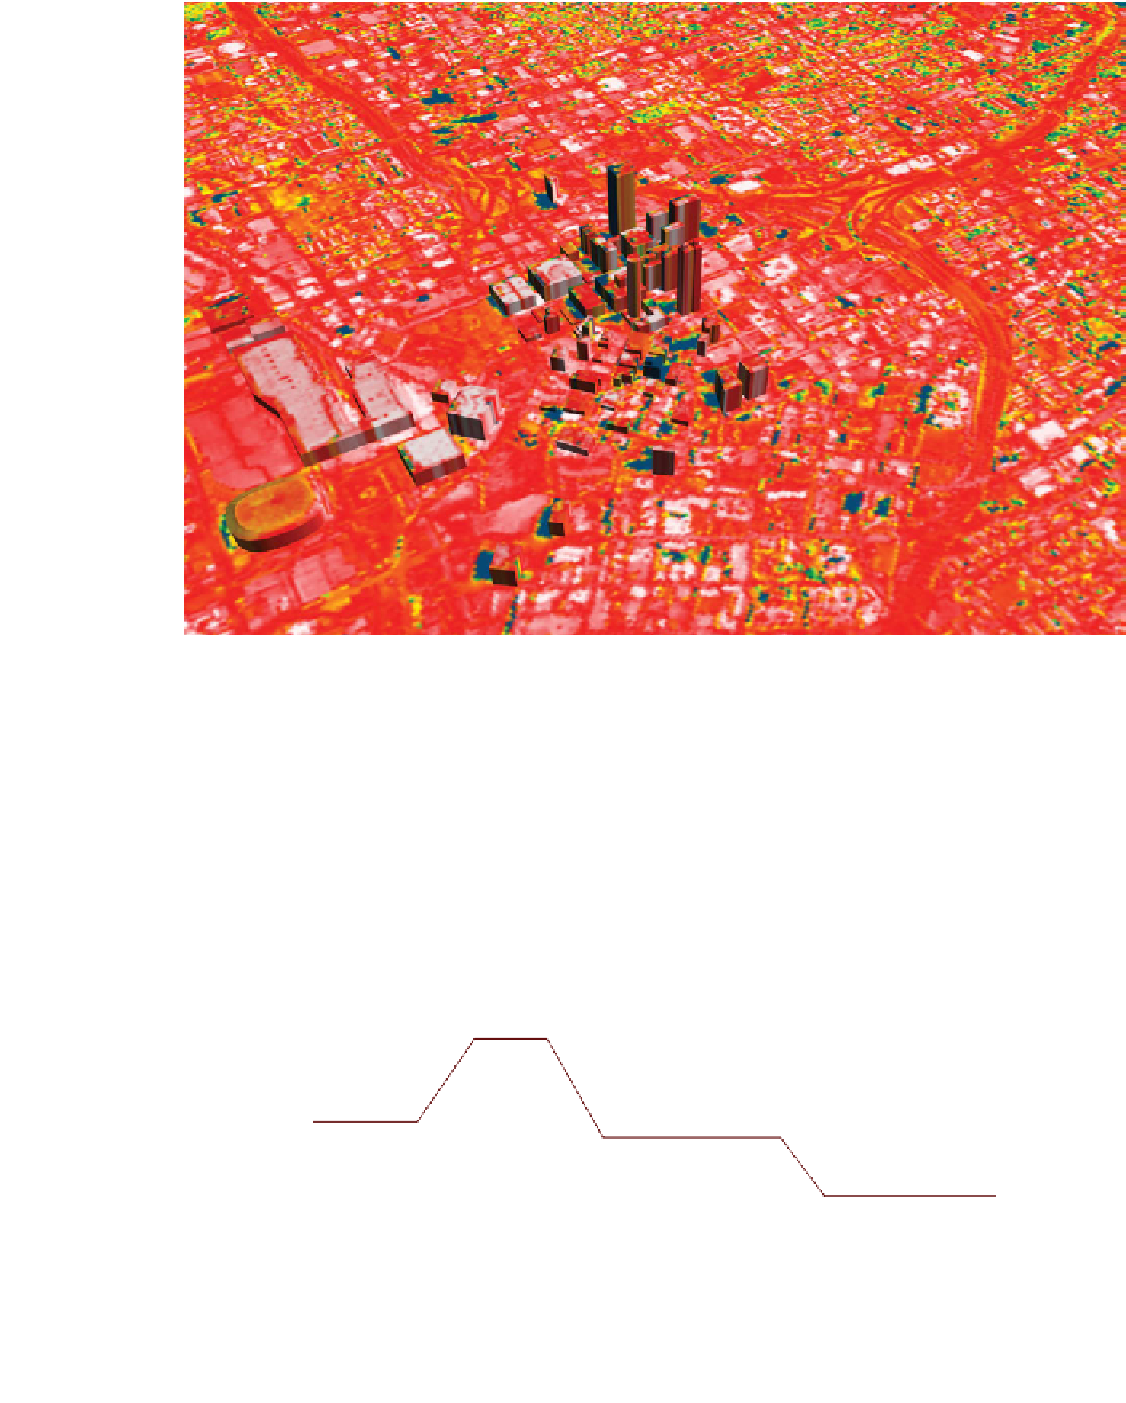
Figure 6.18.
Landsat 5 satellite image with buildings superimposed showing daytime surface temperatures in
Atlanta, Georgia. Temperatures from hot to cold are represented by white, red, yellow, green, and blue,
respectively. Small cool areas in the middle of warm areas are often due to shadows caused by large buildings.
NASA-Goddard Space Flight Center, Scientific Visualization Studio; http://svs.gsfc.nasa.gov/imagewall/AAAS/
Urban_day_temp.jpg.
Meanwhile, some of the diverging air aloft over land
returns toward the water. The convergence of air aloft
over water increases surface air pressure over water,
prompting a stronger flow of surface air from the water
to the land, completing the basic sea breeze circu-
lation cell. At night, land cools to a greater extent
than does water, and all the pressures and flow direc-
tions in Figure 6.19 reverse themselves, creating a
Mount
ain chi
mney effect: injection of pollutants to free tropospher
e
L
H
Large-scale sea-breez
e cell
Elevated pollution layers
H
Basic sea-breeze cell
L
L
H
Desert
Coast
Ocean
(hot)
(warm)
(cold)
Figure 6.19.
Illustration of a large-scale sea breeze circulation cell, basic sea breeze circulation cell, valley
breeze, chimney effect, and formation of elevated pollution layers, as described in the text. Pressures shown
(L and H) are relative to other pressures in the horizontal at the same altitude.


Search WWH ::

Custom Search