Geoscience Reference
In-Depth Information
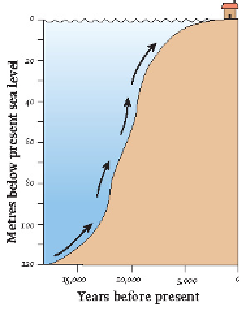
FIG
20.
Graph of sea-level rise over the last 18,000 years.
During the period of most rapid sea-level rise (between 12,000 and 8,000 years
ago), areas of low-lying land were swamped and some local features of the coastal
scenery moved great distances geographically towards their present positions. The sea
cliffs, beach barriers, salt marshes, spits and estuaries that can be seen today have
only taken up their present positions over the last few thousand years, as sea-level rise
slowed.
In the treatment of the Regions and Areas in the rest of this topic, maps are presen-
ted that distinguish a
coastal flooding zone
. This presentation is based on the sim-
plifying assumption that the solid Earth movement of Southern England (i.e. any up-
lift or subsidence, see Chapter 3) has been very small compared with global sea-level
changes. The coastal flooding zone is defined as extending between the submarine con-
tour 120 m below present sea level and the contour 20 m above present sea level, and
it can be used to identify parts of landscapes which are likely to have been areas of
coastline activity in the recent past. Areas of land with an elevation between present
sea level and 120 m below sea level correspond to the land submerged during the last
18,000 years of sea-level rise. Areas lying at, or up to, 20 m above present sea level
may have been subjected to coastal processes during the highest sea levels of earlier in-
terglacial periods, such as the Ipswichian (see Fig. 13). The coastal flooding zone also
defines areas of land that are most likely to become submerged during predicted future
rises of sea level.