Geoscience Reference
In-Depth Information
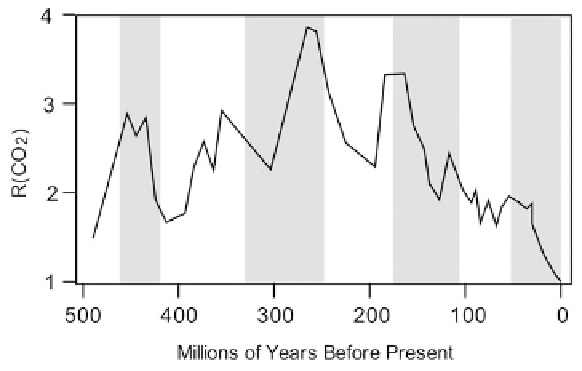
Figure 2.32. R(CO
2
) estimated by Rothman (2002). Gray areas are periods attributed to
''relatively cool climates''.
criticized Rothman's approach, pointing out: ''the calibrations based on the study of
marine plankton do not apply generally to bulk material. Also, it has been shown
that fractionation of carbon isotopes by plant-derived organic matter is not a simple
function of CO
2
, but rather a strong function of atmospheric O
2
that varies with
time
. These considerations indicate that the simple use of
d
13
C to derive
CO
2
values over the Phanerozoic is an inappropriate approach to the problem of
deducing paleo-CO
2
.''
...
2.3.10.4 Comparison of Phanerozoic climate with CO
2
concentrations
Crowley and Berner (2001) said:
''Geologists have long known that on time scales of tens of millions of years,
intervals of continental glaciation were interspersed with times of little or no ice.
The magnitude of warmth during these warm intervals is impressive. [About] 65
to 145 million years ago (Ma)], duck-billed dinosaurs roamed the northern slope
of Alaska. Deep and bottom waters of the ocean, now near freezing, could reach
a balmy 15
C. In the 1980s, a convergence of results from paleoclimatic data and
geochemical and climate models suggested that such long-term variations in
climate were strongly influenced by natural variations in the carbon dioxide
(CO
2
) content of the atmosphere. Lately, some geochemical results have raised
concerns about the validity of this conclusion. CO
2
concentrations over the past
65 million years appear to have reached low levels well before the most recent
phase (the past 3 million years) of Northern Hemisphere glaciation. This is
especially true for times of elevated temperatures at about 50 to 60Ma and
16Ma, when CO
2
was apparently low. A study spanning the Phanerozoic also
suggests some decoupling between times of predicted high CO
2
and some climate
Search WWH ::

Custom Search