Geoscience Reference
In-Depth Information
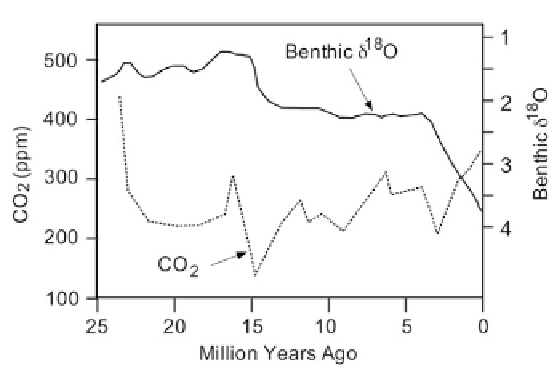
Figure 2.13. CO
2
concentration and benthic
d
18
O (inverse measure of temperature) over the
past 25 million years (adapted from Pearson and Palmer, 2000).
open tropical Pacific, spanning the past 60Myr, augmenting data from six other
previously studied samples.'' Their results for the past 25 million years are shown
discern.
The use of proxies and climate models to infer relationships between climate
and CO
2
concentration has been carried out by a number of investigators
over various time scales ranging up to hundreds of millions of years. In general,
the results require distant extrapolations from short recent calibration periods.
Typically, there is much disagreement between different datasets, and considerable
scatter within any particular set of data. In this section we consider the past 20
million years. van de Wal et al. (2011) provided a review article on CO
2
and
climate over the past 20 million years. Kohler (2011) reviewed this work and
carried out his own analysis partly built upon the work of van de Wal et al.
His graph of estimates of CO
2
concentration over the past 20 million years is
shown in
Figure 2.13
. The eight estimates listed in the upper-right portion were
provided by van de Wal et al. (2011) while Kohler's estimate is shown in black
with a red 400 kyr running mean. Over the most recent 2.7 million years, CO
2
concentrations oscillated with ice age-interglacial cycles. Note that Kohler's
estimate for the early Pliocene was about 300 ppm, which is based on Seki et al.
(2010), whereas Pagani et al. (2010) concluded ''CO
2
concentrations were between
365 and 415 ppm.''
Kohler (2011) adapted a figure from van de Wal et al. (2011) as shown in
Figure 2.14
. Unfortunately, van de Wal et al. (2011) were not entirely clear on the
meaning of ''NH'' in regard to temperature, although they did mention inciden-
tally: ''the reconstructed temperatures are strictly only valid in the continental
areas where ice sheets develop in the NH (
D
T
NH
), being mid- to sub-polar (NH)
latitudes, implying that they are therefore not necessarily representative for the
Search WWH ::

Custom Search