Geoscience Reference
In-Depth Information
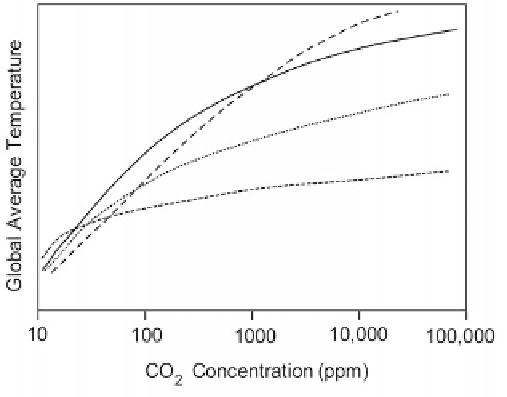
Figure 2.3. Hypothetical curves relating T
G
to CO
2
concentration.
climate. There is a tendency amongst the public, and even amongst many climatol-
ogists, to downplay variations within this relatively stable period and consider the
climate during this limited period to be relatively constant and ''normal''. There is
evidence that the CO
2
concentration remained in the range 270 to 290 ppm during
the Holocene, and variations in T
G
for the most part were probably less than
1
C. With the advent of the industrial age, power plants, cement production,
and other industrial activity spewed out more CO
2
than the Earth could absorb,
and the CO
2
concentration rose steadily in the 20th century, recently reaching
about 395 ppm. Depending on future world consumption of fossil fuels and energy
policy, the CO
2
concentration appears poised to grow in the 21st century, and
may reach some level in the range
500 to
800 ppm by year 2100. There is little
doubt that this will produce further warming of the climate, but how much?
Climatologists have selected a benchmark of a doubling of the pre-industrial level
(280 ppm to
560 ppm) as the standard basis for estimating the future rise in T
G
.
The holy grail of climatology is thus to seek an estimate of how T
G
varies with
CO
2
concentration over the range 280-560 ppm. To put this in perspective, we
show this range in
Figure 2.4
. Not only do we not know a priori which curve
applies to our present situation, but the vertical slice of greatest interest is a very
narrow one in the total scheme of things.
Climatologists have mainly concentrated on the realm of CO
2
concentration
between 280 and 560 ppm, with some concern for higher concentrations up to
900 ppm. In this regard, we can magnify the gray slice from
Figure 2.4
,
and
combine this with known values of T
G
over the past
120 years, as shown in
Figure 2.5
. Curves 1 to 4 show various estimates of the temperature rise that will
be induced by further increases in CO
2
concentration.
The estimates of temperature rise due to increasing CO
2
concentration shown
in
Figure 2.5
ultimately depend on the following analysis. If we start with the pre-
Search WWH ::

Custom Search