Geoscience Reference
In-Depth Information
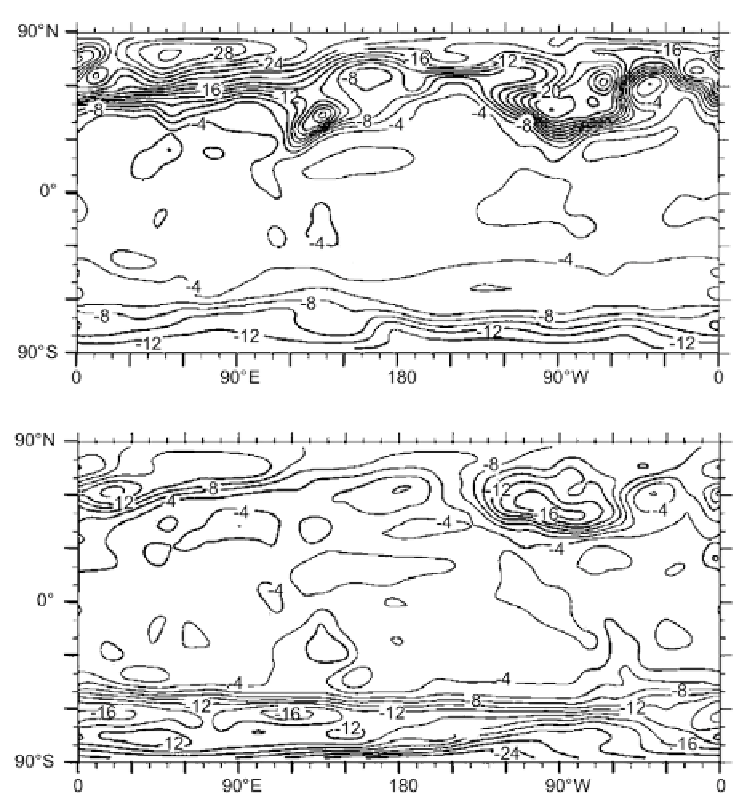
Figure 1.6. Estimated temperatures at the LGM relative to recent temperatures. The upper
figure is for December-January-February while the lower figure is for June-July-August (Shin
et al., 2003).
average, a cooling of 5.9
C. About one quarter of this cooling was attributed to
dust and vegetation changes.
Shin et al. (2003) analyzed the LGM using a climate model. They found that
during northern winter (December-January-February) temperatures over the ice
sheet area in Canada and Europe were typically 16 to 20
C colder than current
temperatures, while in the tropics, temperatures were typically roughly 4
C colder,
and near Antarctica they were about 8
C colder. In northern summer (June-July-
August) the inverse occurred with Antarctic temperatures 16 to 20
C colder and
Arctic temperatures typically 8
C colder than today. A simplified version of their
Search WWH ::

Custom Search