Geoscience Reference
In-Depth Information
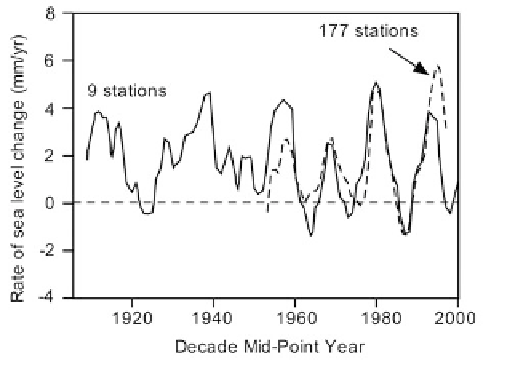
Figure 11.15. Decadal variation of sea level (Holgate, 2007).
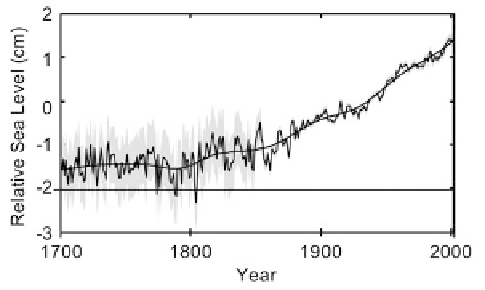
Figure 11.16. Yearly global sea level with 30-year windows. Gray shading represents standard
errors (Jevrejeva et al. 2008).
Wunsch et al. (2007) estimated the regional patterns of global sea level change
from a 1
horizontal resolution general circulation model based on about 100
million ocean observations and many more meteorological estimates between 1993
and 2004. Regional variability was found to be significant. They estimated a
global mean of about 1.6mm/yr, of which about 70% is from the addition of
freshwater. They concluded, however: ''Useful estimation of the global averages is
extremely dicult given the realities of space-time sampling and model approxi-
mations. Systematic errors are likely to dominate most estimates of global average
change: published values and error bars should be used very cautiously''.
Wopplemann et al. (2008) claimed that tide gauge records at Brest, France
were stable between 1889 and 2007. They found that the rate of sea level rise at
Brest was constant over that period. This would suggest that rising CO
2
levels did
not play a role in this case.
Search WWH ::

Custom Search