Geoscience Reference
In-Depth Information
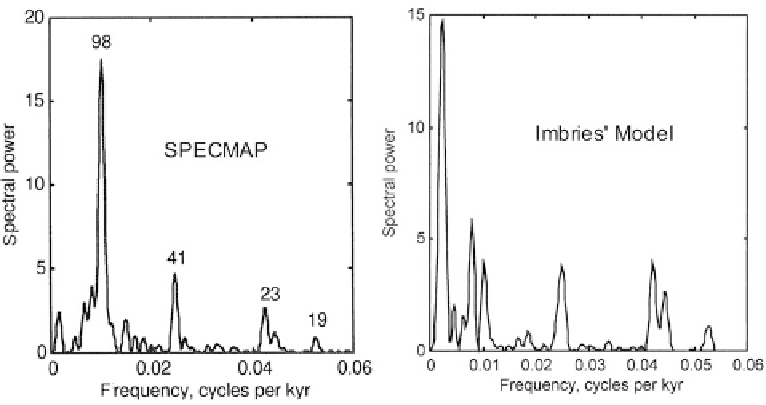
Figure 10.28. (Left) The spectrum of SPECMAP according to M&M. Numerical figures are
time periods in thousands of years associated with principal frequencies. (Right) The spectrum
of the Imbrie ice model (see
Figure 9.14
).
near 100,000 is no longer dominant. In this case a peak corresponding to preces-
sion appears. As in the case of ice core data, the results are suggestive of the
astronomical theory in some ways, but the case is far from ironclad.
Sudden terminations of ice ages occur with nearly vertical lines on the time
series plots that appear at the end of each glacial period. There is a significant
low-level background in the spectral plots which is dicult to resolve. As M&M
said: ''Such sharp changes require a conspiracy of a large number of small com-
ponents at many different frequencies. These small contributions are well hidden
in the frequency domain.''
10.4 STATUS OF OUR UNDERSTANDING
The overall heat balance of the surface of the Earth is dictated by a number of
factors. Three important elements are
.
the rate at which solar energy impinges on the Earth;
.
the fraction of solar energy reflected by the Earth into space (albedo);
.
the effect of greenhouse gases (particularly water vapor, CO
2
,andCH
4
) in the
atmosphere in preventing the escape of radiation emitted by the Earth.
The net albedo of the Earth depends on the global average of all land areas,
but clouds add significantly to global average albedo. The albedo of snow/ice
cover may be as high as 0.9. The albedo of land depends upon the nature of the
Search WWH ::

Custom Search