Geoscience Reference
In-Depth Information
Figure 10.24. Spectra for solar intensity at 65
N and 65
S according to M&M. The 65
S
spectrum does not contain a peak corresponding to precession of the longitude of perihelion
and, since there is no fundamental difference between the south and the north, it seems likely
that the reported spectrum for 65
S is erroneous.
of perihelion and a secondary peak corresponding to obliquity. There is a bare
hint of a contribution from eccentricity. But, the frequency distribution at 65
S
only includes a peak corresponding to obliquity and this makes no sense because
the oscillatory nature of solar intensity is similar for the two polar regions. Hence,
it seems likely that the right-hand side of
Figure 10.24
(taken from M&M) as the
reported spectrum for 65
S is erroneous.
10.3.2.2 Spectral analysis of paleoclimate data
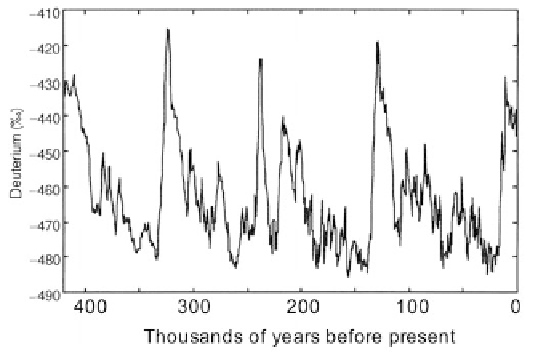
The Vostok deuterium time series is shown in
Figure 10.25
.
Spectral analysis of the Vostok deuterium time series was given by M&M and
is shown here in
Figure 10.26
. Even a casual glance at
Figure 10.25
indicates the
Figure 10.25. Vostok time series (M&M).


Search WWH ::

Custom Search